Keywords: user interface, relationship management, navigation, hypertext, hypermedia, multi- criteria decision analysis.
Furthermore, developers of analytical applications often struggle with
the need to present complicated information in a way users can best understand
it. This involves insightful visualization techniques and user interface
design. This is difficult, and for some applications it simply is not enough
for all users, especially students, novices and those unfamiliar with the
internal details of the application domain (such as a non-technical decision
maker who must make decisions based on the decision analyst's work). Even
for applications with straightforward information displays, users may still
have questions about what a particular item means or how it was determined.
The ability to explore aspects of a piece of information in more detail
could help users resolve doubts about or simply better understand both
that item, as well as the analysis or display of which it is a part. Users
may wish to dig deeper around data values and symbols they see, labels
on graphs or user input forms, options in pop- up lists, information users
enter as input (before actually submitting it), or even on the menu commands
and other controls they can invoke.
In addition, users often have different mental models of an application
(and its underlying domain) than an application analyst or software engineer.
Even when analysts work closely with users, the end result might not be
equally intuitive for all users or serve each user's individual tasks equally
well. A user may wish to access a particular display, function or piece
of information which he or she believes is immediately relevant to the
task at hand, but which the system does not make accessible from the current
screen or its immediate vicinity.
Providing links that represent application relationships that give the user access to what he or she wants is one of the main purposes of hypermedia. We take a two-stage approach to engineering applications for the World Wide Web. First the developer performs a Relationship-Navigation Analysis, analyzing an existing or new application specifically in terms of its intra- and inter-relationships. This leads him or her to better understand the application's complexity and richness. Second, a dynamic hypermedia engine (DHymE), automatically generates links for each of these relationships and metaknowledge items at run-time, as well as sophisticated navigation techniques not often found on the Web (e.g., guided tours, overviews, structural query) on top of these links. The links and navigation, as well as annotation features, supplement the application's primary functionality[ Bieber and Isakowitz 95].
This paper concentrates on the first stage of the Web engineering process. Its purpose is to describe the Relationship-Navigation Analysis (RNA) technique, illustrating its use in a case study of multi-criteria decision analysis software. We aim to show the advantage of adapting a hypermedia vantage point or "philosophy" within the software engineering process for the World Wide Web. We hope to convince developers of the advantages to incorporating hypermedia constructs in their applications. RNA provides a systematic approach to both.
The outline of the paper is as follows. In the following section, we
introduce multi-criteria decision analysis as an example of a complex analytical
technique, and briefly describe the basic components of the model implemented
in the decision analysis software toolkit. In Section 3, we introduce the
Relationship-Navigation Analysis (RNA) methodology, and apply RNA to the
software's decision model. We illustrate extensively how this methodology
has helped us in the discovery of additional functionality, allowing us
to suggest several important modifications to the existing decision analysis
software tool. We briefly discusses implementation approaches, and we conclude
with a short description of our future research challenges in Section 4.
Multi-criteria decision analysis software provides a variety of decision
information management and analysis tools. Although the basic components
of a multi-criteria decision analysis model are rather straightforward,
their many possible interrelationships require a variety of analysis approaches.
This often leads the decision maker to explore the decision problem through
complex analysis paths, turning the decision analysis into a complex and
painstaking endeavor despite the underlying simple model. As a consequence,
it is a major concern of decision analysis software developers to design
the user interface in a way that conveys these intrinsic analysis complexities
in a clear manner. This research provides developers of complex analytical
applications with a systematic approach for supplementing the user interface
with a rich layer of additional functionality. This functionality is based
on the application's internal relationship structure.
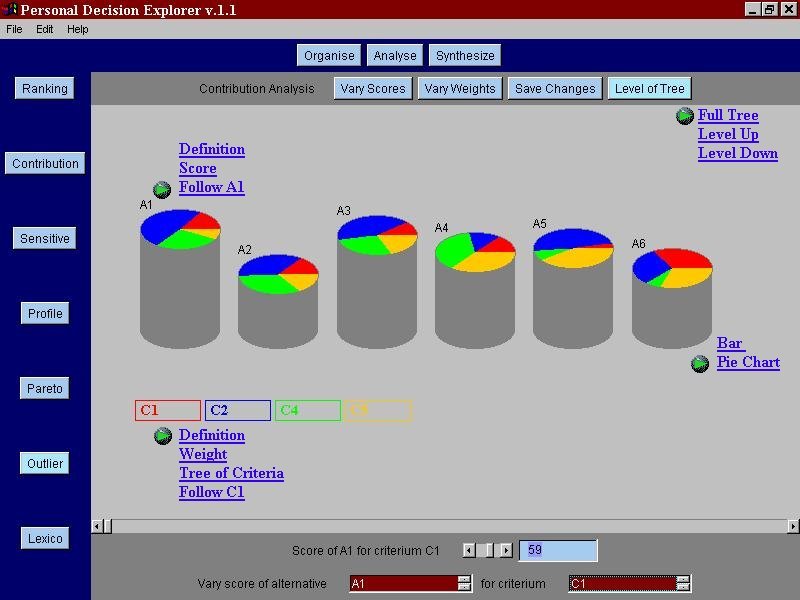
Figure 1. Multi-criteria decision analysis software product :
the ranking analysis screen. Underlined items are relationships found
through the Relationship-Navigation Analysis technique. (PDE 1.1.
Copyright 1997 V. Van der Sluys, All rights reserved).
Figure 1 shows a screen shot of a decision analysis software research product built upon a well-known multi-criteria decision model. The screen provides a number of visual cues to the decision maker, leading to a particular type of decision analysis. This screen exemplifies some of the complexities involved: the decision alternatives can here be analyzed in a number of different ways, where each analysis highlights a different aspect of the model and requires a different representation. This approach rather strongly restricts the decision maker in his exploratory actions because of two reasons. First, the interaction with the decision model is constrained to a rather small number of predefined analysis processes. Second, the components of these processes are not linked: there is no immediate way of switching from one component (e.g., a particular decision alternative) in one analysis to the same component in a different or subsequent analysis. These limitations are common in most decision analysis software packages.
To overcome these and other limitations, as well as to help users cope with the inherent analysis complexities, we decided to make widespread use of hypermedia navigation [Bieber et al. 97, Nielsen 95] for directly accessing the components, processes and results of the decision model. The hypermedia links represent the internal structure of the application's relationships and metaknowledge. This will give users an increased understanding of the decision model, and an increased feeling of control over the many subtleties involved. We chose the Relationship-Navigation Analysis methodology to determine the appropriate links and navigational features for our domain.
Within the realm of multi-criteria decision analysis (MCDA), numerous
techniques, tools and methodologies have been developed to aid decision
makers in the following decision problem: rank order a number of decision
alternatives (or actions), while taking into account multiple -- usually
conflicting -- criteria (or attributes) on which these alternatives are
evaluated [Zeleny 82]. Potential decision areas
include, for example, locating a new facility, evaluating several potential
investments, or even choosing a new car.
The multi-criteria model used in the PDE software product consists of a simple hierarchical weighing model. It is assumed that the decision maker is dealing with a (finite) set of decision alternatives, given by A =3D {A1, A2,... An}, which are evaluated by a (finite) set of criteria C=3D {C1,C2,...,Cm}. The multi-criteria model requires the decision maker to evaluate (by means of a numerical score) each alternative on each of the criteria, to structure the criteria hierarchically in a decision tree, and to weigh the criteria in a well-defined manner. Two new sets result from these procedures: the set of scores S =3D {S11, S12, ..., Snm}, with Sij the score of alternative Ai on Criterion Cj, and the set of weights W =3D {w1,...,wm}, with wj the weight of criteria Cj. The overall or global score S(Ai) of a decision alternative Ai then is defined as the weighted sum of the scores of Ai on all criteria:
The decision problem, i.e., to establish a global ranking of the decision alternatives reflecting the decision maker's preferences vis-a-vis the various criteria, can now be explored in a number of different ways. The decision maker, for instance, may want to perform a sensitivity analysis, in order to investigate the sensitivity of the global ranking with respect to the scores of a particular alternative on a particular criterion, or with respect to the particular weight of this criterion. She may also want to view the contribution of one specific criterion to the global ranking of the alternatives, or follow the behavior of one particular alternative throughout the entire decision process. She may also want to know the profile of an alternative, in order to verify for which criterion the alternative performs extremely well or surprisingly bad. Relevant information may also be retrieved from analyzing a subtree of the hierarchy, leading to a partial ranking of the alternatives.
As is the case in most existing commercial multi-criteria software products however, PDE does not allow for a flexible analysis. Instead, the user is presented with a number of distinct, ready-made processes. However useful these processes indeed are for the analysis, the user is still hampered by the lack of a coherent representation of the many alternative routes to initiate and pursue an exploration of the information at hand.
Like most MCDA software, PDE was designed without a deep analysis of its internal relationship structure, and with only minimal consideration of linking. Exposure to the RNA methodology almost immediately led to an explosion of additional features as it became very clear that hypermedia could alleviate several of the limitations inherent in such complex analysis domains. A further side benefit was that the process of doing an RNA helped us as designers actually understand our application more deeply. Designers in other domains (mathematical model management, education, CASE tools) have informally told us of similar experiences.
In the following section, we use the RNA methodology to explore how
and which additional functionality to provide the user for navigating through
the multi-criteria decision analysis in order to gain a deeper understanding
of the decision problem, and ultimately, a feeling of greater control over
the final decision.
Relationship-Navigation Analysis (RNA) has 5 steps:
In this section we illustrate a relationship-navigation analysis for the PDE MCDA system. While we describe the first four steps of the RNA, we concentrate primarily on step 3: the relationship and metaknowledge analysis.
First, we distinguish the user role of decision builder or decision information provider. He or she often is a domain expert, giving expert advice to a decision maker. This user is interested in organising his thoughts on the decision problem in a formal model, and in having a first look at the decision analysis, without feeling the need of going into too much detail during this analysis phase. His activities are largely restrained to organising the relevant information for the decision problem in a structured way, according to the decision model provided. In a group decision setting [Van de Walle et al. 97], we may view this user as a decision team member, who contributes important information to the decision, but does not have the authority or the interest to further analyze the group's decision.
Second, we distinguish the user role of decision analyst. This user is interested in the technicalities of the decision problem, and in performing the necessary operations to disclose the -- usually non-obvious -- underlying problems. In a group decision setting, we may view this user as an analyst providing the rationale of a group's decision to a decision maker, based upon the information provided by the individual decision builders.
Finally, we can distinguish the user role of decision maker. He or she is the task leader or manager interested in merely browsing through the details of the decision problem, but mostly interested in a concise executive summary of the analysis provided by the decision analyst, based upon the information of the decision builder.
The multi-criteria decision analysis software is adapted towards these three user profiles by providing tailored procedures within three corresponding categories, or phases, of the decision process: the organisation phase (which would be most appropriate for the decision builder), the analysis phase (for the decision analyst), and the synthesis phase (for the decision maker concluding the decision problem).
For a larger scale decision analysis package, stakeholders include not
only the analysts who would use the application and managers who have to
act on the analyses, but also new employees who have to learn about a domain,
those who fund the department using the analysis package (to understand
why certain strategies were followed and others rejected), and the organization's
legal department which may have to defend the department's decisions in
lawsuits several years after decisions were implemented [Kimbrough
et al. 90; Bieber 92].
In this phase, the following elements of interest are the building
blocks of the decision model: the alternatives, the criteria, the structured
tree of criteria, the scores (evaluations) of the alternatives on each
of the criteria, and the weights reflecting the importance of the criteria.
RNA uses the following general relationships: schema, process, operation, structural, descriptive, attribute, occurrence, similarity, statistical, collaborative, ordering, and contingent.
Analysts should employ this set of relationship types as a kind of brainstorming
tool help them consider different aspects of their domain. As such the
categories overlap to some degree, allowing different analysts to find
the same relationships through different prompts. Analysts are free to
add new categories to this core set that better fit their own mental models
of their domain. [Bieber 97, Bieber
and Vitali 97] give additional cursory examples of relationship analyses.
Note that these are general kinds (classes or categories) of relationships one finds in different computational applications. Various hypermedia researchers have come up with different link taxonomies [Trigg and Weiser 86, Wang and Rada 95, Oinas-Kukkonen 96] which contain specific link types for particular applications or domains. These could fall across several of our general link categories. Note too that we have compiled the above set of general link categories based on personal experience in developing and using applications. It is not complete. Neither have we tried to normalize it; a particular semantic link type might fall in more than one category, which is useful in brainstorming where different keywords may trigger the same relationship with different people. In any event, we have found the current set very useful in thinking about providing relationship management support to analytical computer applications.
One could consider the relationship linking each of the above three fundamental phases as a high-level or process relationship:
Organize - Analyze - Synthesize.
Obviously, a particular user may not be interested in exploring in full detail each of the phases, though a group as a whole must perform all three. Within each of the phases, we can distinguish the following local process relationships.
Define alternatives - define criteria - build tree - score each
alternative on each criterion - weigh the criteria - view ranking
We may distinguish a panoply of local process relationships, such
as for instance the following elementary processes starting from an element
of interest:
|
|
|
| Alternative | perform Pareto analysis |
| perform Outlier analysis | |
| perform Profile analysis | |
| Criterion | view position in criteria hierarchy |
| view trade-off |
From a more global point of view, a process relationship may also span
the three fundamental phases, e.g., the procedure to select any given number
(be it a score of an alternative, or a weight of a criterion) and to view
an account of how this number was calculated, may be viewed as a process
relationship.
The following process constructs an executive overview for the decision
for a manager:
view ranking - generate summary tables - comment on summary - motivate decision.
|
|
|
| Alternative | Add |
| Delete | |
| Describe | |
| Criterion | Add |
| Delete | |
| Describe | |
| Criteria Tree | Structure |
| Weigh |
|
|
|
| Alternative | Definition |
| Score | |
| Ranking | |
| Any analysis | |
| Criterion | Definition |
| Tree Weights | |
| Tree | Ranking |
| Any analysis |
Occurrence relationships could include all decisions that use the same specific criterion, all criteria that have the same normalized weight value; all executive summary reports that discuss the same family of criteria; and all equations in the analysis phase analyses that use the same variables.
|
|
|
|
| Alternative | Definition | Score |
| Criterion | Definition | List of criteria |
| Tree | List of criteria | Weights of criteria |
| Weight | Criterion | Trade-off information |
| Score | Alternative | Ranking |
Within the decision analysis software product, the following navigation features would be extremely powerful.
Each of the schema, process, ordering or occurrence relationships could be linked by overview navigation. We could imagine, for instance, that an overview could be generated for each of the alternatives, so that the decision maker can follow an alternative throughout the organisation and synthesis phases. In this way, the decision maker can view the alternative's score on each of the criteria, its worst and best evaluation, its relative position, etc. In the different setting of group decision analysis, we can think of an overview available to a group of decision analysts in which every member can view the criteria tree of every other member.
A guided tour may be extremely useful for the decision maker, assisting him in the selection of the most relevant screens to look at. The composition of the executive report in the decision synthesis phase may be viewed as a guided tour. For a novice in the area of the decision problem, a guided tour may assist in guiding this user through the real issues of the problem. A general public report, or a report for a commission or external advisory group may also be implemented as a guided tour.
In the decision analysis software, we could have structural queries for asking questions such as: "show all analyses having more than two criteria related to the issue of project costs", or "show all analyses involving more than two decision makers", or even "show all alternatives which have appeared in the department's different decisions taken since 1996", etc.
[Bieber and Kacmar 95; Bieber et al. 97; Maurer 96; Nielsen 90, Nielsen 95] discuss these and several other navigation features in more detail.
While this paper's scope does not include implementation, implementation
clearly is on our agenda for the near future. In general, developers can
take two approaches. One can add hypermedia functionality to a nonhypermedia-based
application or one can implement the application in a hypermedia environment.
There are several approaches to integrating hypermedia functionality into
primarily non-hypermedia information systems. These include incorporating
stand-alone hypermedia features using developer toolkits, extending applications
to work cooperatively with link services or open hypermedia systems, or
executing the applications in conjunction with independent hypermedia engines.
[Bieber 97] describes these approaches in more
detail, as well as describing our own independently executing hypermedia
engine, which automatically generates links for the relationships determined
using the RNA analysis [Bieber 95, 97].
Regarding hypermedia application environments, many commercial and research
hypermedia systems exist.
For the authors personally, using the RNA methodology has greatly increased the understanding of the multi-criteria decision analysis model and its many possible approaches to analyzing the model's resulting ranking. By carefully listing the various types of relationships, we have been able to suggest new ways to visualize relevant decision information and both provide new access to and navigation through this information.
Future work in this application domain will continue in the challenging situation of group decision making. Indeed, one can easily think of the additional complexities and the corresponding additional relationships involved when a group of people is contributing and analyzing the model. Our future work will focus on how to use the RNA methodology to explore hypermedia functionality in this new setting.
While quite useful in its current form, we intend to develop the RNA technique further by producing specific guidelines for each step and by reducing the range of options that the analyst must consider within steps 2-4 of the analysis. These refinements should make the analysis more systematic and easier to conduct, while allowing it to remain necessarily open-ended. We also plan to investigate a more complete and theoretically robust taxonomy of link categories. Although we have found other general taxonomies [DeRose 89, Parunak 91, Rao and Turoff 91] insufficient for our domain of generic analytical application support, we might incorporate and use them as a starting point. Furthermore, we intend to develop an exact procedure for coordinating RNA with other systems analysis and design methodologies.
When developers convert legacy systems to the World Wide Web, few take
the time to reengineer the applications to take full advantage of the Web's
hypermedia linking facilities. RNA provides a way to determine the opportunities
for linking in applications. In addition, as we have seen in this paper,
hypermedia links provide an alternative approach to making complex applications
understandable and effective. This line of research aims to convince software
developers both off and on the Web to take deep advantage of hypermedia
in at least part of their application development process, as well as their
application's feature set. We hope to inspire analysts and designers in
many more application areas to design access and support around an application's
relationship structure.
[Bieber 95] Bieber, M. "On integrating hypermedia into decision support and other information systems", Decision Support Systems 14 1995, 251-267.
[Bieber 98] Bieber, M. "Hypertext and Web Engineering,"
Proceedings of the Ninth ACM Conference on Hypertext and Hypermedia, ACM
Press,
277-278, 1998.
[Bieber and Kacmar 95] Bieber, M. and Kacmar, C., "Designing hypertext support for computational applications", Communications of the ACM 38(8), 1995, 99-107.
[Bieber and Vitali 97] Bieber, M. and Vitali, F., "Toward support for hypermedia on the World Wide Web",IEEE Computer 30(1), 1997, 62-70.
[Bieber et al. 97] Bieber, M., F. Vitali, H. Ashman, V. Balasubramanian and H. Oinas- Kukkonen, "Fourth Generation Hypermedia: Some Missing Links for the World Wide Web", International Journal of Human Computer Studies 47, 1997, 31-65.
[Brans and Vincke 85] J.P. Brans and Ph. Vincke, "A preference ranking organization method, the PROMETHEE method", Management Science 31, No. 6 (1985), 647-656.
[Christodoulou et al. 98] Christodoulou, S. P., Styliaras, G. D., and T. S. Papatheodorou, "Evaluation of Hypermedia Application Development and Management Systems," Proceedings of the Ninth ACM Conference on Hypertext and Hypermedia, ACM Press, 1-10, 1998.
[De Baets and Van de Walle 94] B. De Baets and B. Van de Walle, "Dependencies among alternatives and criteria", Proceedings of CIFT'94, Fourth International Workshop on Current Issues in Fuzzy Technologies (1994), 80-85.
[DeRose 89] DeRose, S. Expanding the notion of links. Hypertext '89 Proceedings, Pittsburgh, PA, November 1989, 249-257.
[Durand and Kahn 98] Durand, D. and Kahn, P., "MAPA: A System for Inducing and Visualizing Hierarchy in Websites," Proceedings of the Ninth ACM Conference on Hypertext and Hypermedia, ACM Press, 66-76, 1998.
[Dyer et al. 92] J.S. Dyer, P.C. Fishburn, R.E. Steuer, J. Wallenius and S. Zionts, "Multiple criteria decision making, multiattribute utility theory: the next ten years", Management Science 38, No. 5 (1992), 645-654.
[Fraïssé et al. 95] Fraïssé, S., Garzotto, F., Isakowitz, T., Nanard, J. and Nanard, M. (eds.), International Workshop on Hypermedia Design U95 Proceedings, Montpellier (June 1-2, 1995).
[Furuta et al. 97] Furuta, R., Shipman, F. Iii, Marshall, C., Brenner, D. and Hsieh, H., "Hypertext Paths and the World-Wide Web: Experiences with Walden's Paths", Hypertext'97 Proceedings (Southampton, April 1997), 167-176.
[Garzotto et al. 96] Garzotto, F., Mainetti, L. and Paolini, P., "Navigation patterns in hypermedia data bases", Journal of Organizational Computing and Electronic Commerce 6(3), 1996, 211-237.
[Halasz 88] Halasz, F., "Reflections on NoteCards: seven issues for the next generation of hypermedia systems", Communications of the ACM 31(7), 1988, 836-855.
[Isakowitz 93] Isakowitz, T., "Hypermedia in Information Systems and Organizations: A Research Agenda," Proceedings of Twenty-Sixth Annual Hawaii International Conference on System Science (HICSS) (Maui, Jan. 1993), Volume III, 361-369.
[Isakowitz et al. 95] Isakowitz, T., Stohr, E. and Balasubramanian, P., "RMM: A methodology for structuring hypermedia design", Communications of the ACM 38(8), August 1995, 34-44.
[Isakowitz et al. 98] Isakowitz, T., Bieber, M. and Vitali, F. (eds.), "Web Information Systems", Communications of the ACM 41(7), 1998.
[Kaindl et al. 98] Kaindl, H., Kramer,
S. and Afonso, L. M., "Combining Structure Search and Content Search for
the World-Wide Web," Proceedings of the Ninth ACM Conference on Hypertext
and Hypermedia, ACM Press, 217-224, 1998.
[Landow 90] Landow, G., "Popular fallacies about hypertext", in Jonassen, D. and Mandl, H. (eds.) Designing hypermedia for learning, Series F. Computer and Systems Sciences 67, Springer- Verlag, 1990, 39-59.
[Lange 96] Lange, D., "Object-Oriented Hypermodeling of Hypertext Supported Information Systems", Journal of Organizational Computing and Electronic Commerce 6, No. 3, 1996, 269-293.
[Lee et al. 96] Lee, Y. K., Yoo, S-J., Yoon, K. and Berra, P., "Querying structured hyperdocuments", Proceedings of the Twenty-Ninth Annual Hawaii International Conference on System Sciences (Wailea, Maui; January 1996), IEEE Press, Washington, D.C., Volume II, pages 155-164.
[Maurer 96] Maurer, H., HyperWave: The Next Generation Web Solution, Addison Wesley, London, 1996.
[Marshall and Irish 89] Marshall, C. and Irish, P., "Guided tours and on-line presentations: how authors make existing hypertext intelligible for readers", Hypertext '89 Proceedings (Pittsburgh, Nov. 1989) 15-42.
[McCall et al. 90] McCall, R., Bennett, P., D'Oronzio, P., Ostwald, J., Shipman, F. Jr. and Wallace, N., "PHIDIAS: Integrating CAD Graphics into Dynamic Hypertext", In: Rizk, A., Streitz, N. and André, J., eds., Hypertext: Concepts, Systems and Applications, Proceedings of ECHT'90, Versailles, November 1990. Cambridge: Cambridge University Press, 152-165.
[Nielsen 90] Nielsen, J., "The art of navigating through hypertext", Communications of the ACM 33(3), March 1990, 296-310.
[Nielsen 95] Nielsen, J.,Multimedia and Hypertext: The Internet and Beyond, AP Professional, 1995.
[Oinas-Kukkonen 96] Oinas-Kukkonen,
H., Debate Browser - An Argumentation Tool for MetaEdit+ Environment,"
Proceedings of the
Seventh European Workshop on Next Generation of CASE Tools (NGCT Ô96),
Crete, Greece, 1996, 77-86.
[Parunak 91] Parunak, H. "Ordering the information graph" in Hypertext/hypermedia handbook, Berk, Emily and Joseph Devlin (eds.), Intertext Publications/McGraw-Hill Publishing Co., Inc., New York, 1991, 299-325.
[Rao and Turoff 90] Rao, U. and Turoff, M., Hypertext functionality: a theoretical framework. International Journal of Human-Computer Interaction 2(4), 1990, 333-358.
[Roy 90] B. Roy, "The outranking approach and the foundations of ELECTRE methods", in Readings in Multiple Criteria Decision Making, C. Bana e Costa (ed.), Springer-Verlag (1990), 155-183.
[Saaty 80] T. Saaty, "The analytical hierarchy process", McGraw-Hill, New York.
[Schwabe et al. 96] Schwabe, D., Rossi, G. and Barbosa. S., "Systematic hypermedia application design with OOHDM" Hypertext'96 Proceedings, March 16-20, 1996, 116-128.
[Shipman et al. 98] Shipman, F. M. III, Furuta, R., Brenner, D., Chung, C. and Hsieh, H., "Using paths in the Classroom: Experiences and Adaptations," Proceedings of the Ninth ACM Conference on Hypertext and Hypermedia, ACM Press, 267-276, 1998.
[Thüring et al. 95] Thüring, M., Hannemann, J. and Haake, J., "Hypermedia and cognition: designing for comprehension", Communications of the ACM 38(8), 1995, 57-69.
[Trigg and Weiser 86] Trigg, R. and Weiser, M., "TextNet: A network-based approach to text handling", ACM Transactions on Office Information Systems 4, No. 1 (1986) 1-23.
[Utting and Yankelovich 89] Utting, K. and Yankelovich, N., "Context and orientation in hypermedia networks", ACM Transactions on Information Systems 7, No. 1 (1989) 58-84.
[Van de Walle et al. 95] B. Van de Walle, B. De Baets and E. Kerre, "Fuzzy multi-criteria analysis of cutting techniques in a nuclear reactor dismantling project", Fuzzy Sets and Systems 74 (1995), 115-126.
[Van de Walle et al. 97] B. Van de Walle, M. Turoff, M. Bieber and A. Rana, "Integrating soft computing in group decision support systems: a taste of the challenges and opportunites", AAAI 1997 Fall Symposium on Frontiers in Soft Computing and Decision Systems, Boston, Mass.
[Van de Walle et al. 98] B. Van de Walle, M. Bieber and M. Turoff, "Collaborative relationship navigation analysis for group multi-criteria decision making", Technical Report, CIS Department, New Jersey Institute of Technology, 1998.
[Wang and Rada 95] Wang, W. and Rada, R., "Experiences with Semantic Net Based Hypermedia," International Journal of Human-Computer Studies, 43, 419-439, 1995.
[Zeleny 82] M. Zeleny, "Multiple Criteria
Decision Making", McGraw Hill, 1982.