What we have not talked
about yet is how to tell how big they are. This is a very important point,
but it takes a couple of steps we haven't learned yet. If a star appears
only as a point of light, how can be tell how big the star really is?
We cannot just measure its size. It turns out that we need two bits of
information -- its distance, and its luminosity.
We earlier defined the Sun's luminosity as the total power output of the Sun
(3.8 x 1026 watts). We will refer to the
luminosity of other stars in units of the Sun's luminosity, so let's give it
a symbol, Lsun. A star with twice the
power output of the Sun would have a luminosity of 2 Lsun.
Note that luminosity is an intrinsic property
of a star, meaning that it does not depend on how far away the star is.
In fact, we often emphasize this by using the term intrinsic
luminosity.
As it turns out, the nearest star
other than the Sun, alpha Centauri, has slightly greater luminosity as the
Sun. But note that the Sun lights up our day on Earth, while Alpha Centauri
appears only as a faint point of light, invisible except at night. Obviously
the reason is that Alpha Centauri is very far away, while the Sun is nearby.
If we knew how the apparent brightness of an object changes with distance,
could we compare the apparent brightness of the Sun and Alpha Centauri and
tell how far it is to Alpha Centauri?
 |
The
sky centered on the star Kappa Orionis. Although Kappa Orionis looks
much larger than the other stars in this image, that is an illusion
caused by overexposure of the film. Without the overexposure,
the image of Kappa Orionis would be the same size as the faintest
of the other stars in the image -- a single point of light.
Is Kappa Orionis
brightest because it is the star nearest to us in this image?
No, it is about 815 ly distant, while the star just above it is
only 75 ly away!
|
It is easy to figure out how apparent
brightness falls off with distance. Consider the surface of a star,
and all the energy passing through this surface each second. This is
the luminosity. Now imagine another sphere centered on the star, but
at some greater size. The same energy per second must also pass through
this larger sphere -- none of the energy disappears. Now imaging a series
of spheres, each one passing the same amount of energy per second. The
surface area of each sphere grows as the radius squared, and since the energy
is the same through each sphere, it follows that the power per unit area (=
brightness) falls as 1 over distance squared:
1/d2.
That is, the brightness (energy flux) follows an
inverse square law.
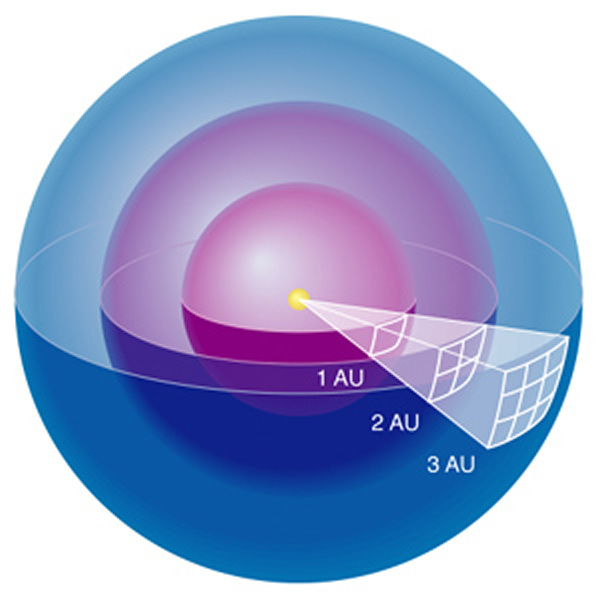
Figure 15.1 from the
text. The area of each sphere increases as the square of the distance,
so the
flux per unit area falls as the square of the distance. The apparent
brightness is the same as the flux
per unit area, so the apparent brightness also falls as the square of the
distance.
This gives the luminosity-distance
formula:
apparent brightness =
luminosity / (4p
x distance2)
So of two stars with the same
luminosity, the one that is farther away certainly has a smaller brightness.
But stars do not all have the same luminosity, as is shown by the case of
Kappa Orionis, above.
Lecture
Question #1
Measuring Distance
To sort out which stars are faint
because they are far away, and which stars are faint because they have a low
luminosity, we have to find some way to measure distances to stars.
This is a LOT harder than it may seem. The whole problem of distances
to objects in the universe is a fundamental one, and it has a name -- the
distance scale. The distance scale
is a set of measurements going from small distances to larger and larger ones.
The first step in the astronomical distance scale is to know the distance
to the Sun, 1 AU, which we now know to be 150 million km. Once we know
this distance, we can use the motion of the Earth around the Sun to look for
small annual position variations due to parallax.
(Note that this is exactly the same cause as retrograde motion of distant
planets).
Measuring the position of nearby
stars relative to distance stars over 6 months (January to July in the figure
above), we can find that the star appears to shift a small angle p,
called the parallax angle. This
turns out to be a very small angle, even for the nearest stars -- less than
1 arcsecond (1/3600 of a degree) for Alpha Centauri. If a star were
close enough to cause a shift of exactly 1 arcsecond, we would say that it
is 1 parsec or 1 pc away. The word
parsec comes from the words parallax and arcsecond. Astronomers measure all
distances in parsecs, not light-years. But there is a simple relationship,
1 pc = 3.26 ly. The reason astronomers use parsecs is that there is
a particularly simple relationship between parallax and distance:
d (in parsecs)
= 1 / p (in arcseconds)
We can measure angles to about 0.01
arcsecond, which means we can measure star distances using stellar parallax
only to distances d = 1/0.01 = 100 parsecs (about 326 light-years).
Stars farther away than that show no measurable shift as the Earth orbits the
Sun. Stellar parallax gives the second step in
the distance scale. There are more steps that we will learn
about later.
When we look at which stars in
the sky show parallax, and so are the closest stars to us, we may be surprised
to find out that many are very dim -- not even visible without a telescope.
Some brighter stars turn out to be pretty close, like Sirius (2.6 pc), Altair
(5 pc), and Fomalhaut (7 pc), but many bright stars are so far away that they
show no parallax. That means the intrinsic luminosity of stars must
vary enormously.
In the 1990's the Hipparchos satellite
measured the parallax of almost 1 million stars at distances out to 200 pc
(parallax of 0.005 arcsec). Before that, only a few thousand stars had accurately
known parallaxes. Proposed space missions of the future are expected to be
able to measure parallaxes out to 25000 pc--almost the entire distance across
the galaxy!
Astronomers measure the
brightness of stars in magnitudes.
It is based on a system devised by the ancient Greek astronomer Hipparchus (c.
150 BC), who divided the brightness of stars into those of the first magnitude
(the brightest), next brightest to 2nd magnitude, and so on down to those just
visible with the naked eye as the 6th magnitude. Modern astronomers have
a problem, however, since they can see far fainter stars with the aid of telescopes
and cameras. They wanted to extend this system to fainter stars, so to
do that they noted that it covered a range of about 100 in brightness (the brightest
stars are 100 times brighter than the faintest). To be quantitative, they
set a range of 5 magnitudes as exactly equal to a factor of 100. This
has the effect of making some bright stars have even lower (brighter) magnitude
than 1, so they go to zero, and even become negative. We can assign a
brightness to the Sun, and find that it is -26th
magnitude! So remember that the magnitude scale is kind of backwards --
the brighter stars have smaller magnitudes.
Note that these are apparent
magnitudes. If we get closer to Alpha Centauri, for example,
it will appear brighter and the Sun, which we are moving farther away from,
will appear fainter. So apparent magnitude can change depending on where
we are. Astronomers like to express the brightness of stars also in
absolute magnitude, so that it expresses
the actual brightness of the star no matter how far away they are. So
we figure out how bright a star would appear if it were at a distance of 10
pc (32.6 ly), and call that the absolute magnitude. The Sun would have
a magnitude of about 4.8 (not very bright) if it were at a distance of 10
pc. So its absolute magnitude is 4.8.
Lecture
Question #2
If you look at a star catalog,
you will see the star magnitudes, along with other information for the
star. Here is an example from the "Nearby Stars" catalog (stars within
25 pc):
The columns marked mV
and MV give the apparent
and absolute magnitudes, respectively. In order to know the
absolute magnitude, note that we have to know the distance to the star.
For these nearby stars, we can actually measure their parallax. For
more distant stars we have to use another trick, which we will learn next
time.
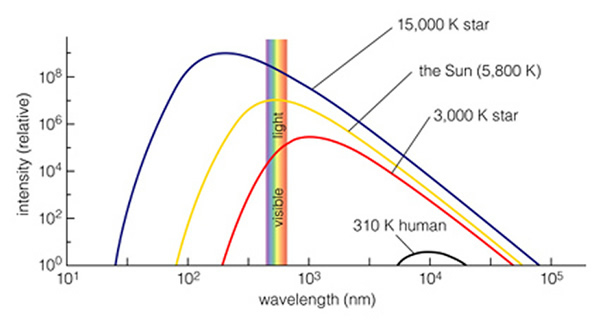
Remember that these
lines tell us what the star is made of, but the light between the spectral
lines also tells us the temperature of the star. To make sense of
stars, we find it useful to try to classify them according to their spectrum.
Even before it was knows what the spectral lines were, scientists were
able to take pictures of the spectrum and try to put them into some kind
of order. At Harvard College Observatory, Edward Pickering had a
large collection of stellar spectra, and hired women from nearby colleges
to help classify them. To begin with, the spectra were classified
according to how strongly the hydrogen lines stood out. Williamina
Fleming (1857-1911) was the first to do this, and called the types A, B,
C, and so on according to the strength of the hydrogen lines. The
spectrum above is from an A star, because it has the strongest hydrogen
lines. Later, another woman, Annie Jump Cannon (1863-1941) recognized
that by classifying not according to the hydrogen lines, but according
to the star's color, or continuum spectrum, and thus in a temperature order,
the spectra fell into a natural sequence. She stuck with Fleming's
letter designations, but reordered them so that, in temperature order they
become O, B, A, F, G, K, and M. Here, O stars are the hottest (bluest)
and M stars are the coolest (reddest).
It
is very important to memorize the order of these letters. To help
you, there are several mnemonics. The classic one is "Oh Be A Fine
Girl/Guy, Kiss Me."
Here is what the new ordering
of spectra looks like:
Adapted from data in the electronic version of "A Library of Stellar
Spectra," by Jacoby G.H.,
Hunter D.A., Christian C.A. Astrophys. J. Suppl. Ser., 56, 257
(1984).
Notice that the letter classification
is subdivided with a number, so the strongest hydrogen lines are
in an A0 star, and an A1, A2, etc. are slightly cooler up to A9.
Then next cooler star is F0, and so on. Notice also that the hydrogen
lines are quite weak in the hottest stars (O stars). The Sun is classified
as a G2 star, so its hydrogen lines are not very strong.
Lecture
Question #3
Strength of Hydrogen Lines
and Temperature
We now know that all stars are
basically made of the same stuff, and all have about the same amount of hydrogen
(about 75%) and helium (about 25%), with trace amounts of other elements.
So why do the hydrogen lines stand out so strongly in some stars and not in
others. It turns out that the strength of the lines depends on the surface
temperature of the star much more than the composition. In the
hottest stars, most of the hydrogen is ionized (the electrons are stripped
off), so there are only weak lines (remember that the lines are due to transitions
of electrons in orbit around the hydrogen nucleus). In the coolest stars,
most of the hydrogen is in the ground state, so the electrons are there, but
they do not make the transitions needed to form the lines. Only in stars
with surface temperature around 10,000 K do we see hydrogen atoms in excited
states, but not too ionized.
There is one more
quantity that we will need before we can put all of this together and explain
how we know so much about stars, even though they are mere points of light.
The missing quantity, the stellar mass,
turns out to be the most important quantity of all. Since all stars
are made of the same stuff, there must be something that causes them to
have different temperatures, and sizes, and of course this is just due
to differences in stellar mass. How can we measure masses?
For that we need a little help from the stars themselves -- basically we
need the stars to come in pairs. In that case, the stars will orbit
around each other and if we measure their positions over a long enough
time we can determine their
orbital periods and their semi-major axes. Then, using Kepler's
Third Law (law of periods), along with Newton's modification of it:
P2 = [4p2/G(M1
+ M2)] a3
Once we measure the period P
and the semi-major axis a, we
can insert them into this equation and solve for the sum of the masses.
Let's try this for the visual binary
star Xi Bootes, shown in the following figure:
It's period is 151.5 years, and
its major axis is about 6 arcsec. To find the semi-major axis, we divide
this in half to get 3 arcsec, but we also need to know the distance to the
star system to convert arcsec. The distance to the star system (from
their parallax) is 6.71 pc, for which the 3 arcsec semi-major axis becomes
3 x 10¹² m. So plugging in 151.5 years
for the period, and 3 trillion meters for the semi-major axis, we solve for
the sum of masses to get 7 x 1029 kg.
This turns out to be only about 1/3 the mass of the Sun, so both of these
stars together have a mass less than 1/3 of the Sun.
Lecture
Question #4
Other
types of binary star systems
Another type of binary star
is called an eclipsing binary. where
one star actually passes in front of the other (causing an eclipse).
Algol (the star in Perseus, representing the evil eye of Medusa) is an
eclipsing binary. A final type is the spectroscopic
binary, in which the stars are so close together that we cannot
see them separately, but we know there are two because of the doppler shifts
of their spectral lines.