Math 225-001, Quiz # 1 Fall 2003 September 15
Name_________________
Student
#______________
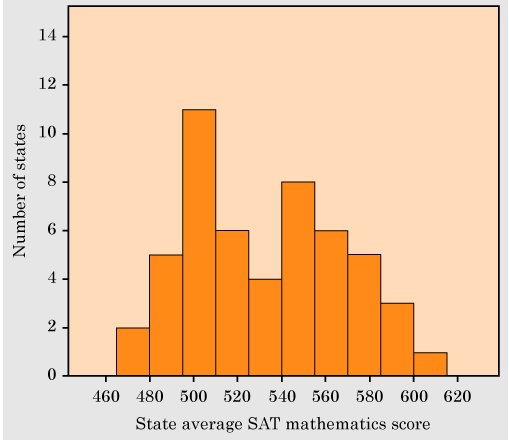
- In the above figure
would the mean SAT mathematics score be clearly smaller that the median,
about the same as the median, or clearly larger than the median? Why?
(5 pts)
The distribution of the SAT mathematics scores are
roughly symmetrical, therefore we would expect the mean to be close to the
median.
- Immigrants in the
eastern states. Here are the number of immigrants (in thousands ) who
settled in each state east of the Mississippi River in 1997:
|
- Find the mean and the median
of these data with and without New York. Which measure is more changed
when we omit the outlier?
(10
points)
|
Type of Data |
Sample mean |
median |
|
All
the data values |
16.63461538 |
13.5th
observation = 5.15 |
|
Data
values without NY |
12.352 |
13th observation = 4.4 |
The
difference between the sample means is about four units whereas the difference
between the medians is less than a unit. Thus, the sample mean is more changed
compared to sample median when we omit the outlier.
- Compute the Range and
Standard Deviation of these data.
(5
points)
Range = Largest
observation minus the smallest observation = 123.7 - 0.6 = 123.1.
Standard deviation s = 28.22252919.