We can "see" inside the Sun using helioseismology, allowing us to determine how the Sun rotates and how that rotation interacts with convection to give complicated motions. The interior of the Sun is made of a highly conducting fluid of charged particles (a plasma), and these motions generate electrical currents. Any electrical current has a magnetic field associated with it. Since the material of the Sun is so highly conducting, the magnetic fields are "frozen in" to the fluid and cannot move independently. The fluid will concentrate the magnetic field until the energy density in the magnetic field equals the energy density of the gas. We have already seen what the gas energy density is (an energy density has units J / m3 = N / m2 = F / A but force per unit area is pressure) P = nkT. The energy density in the magnetic field (or the magnetic field pressure) is B2/2m0. where B is in Tesla, and m0 = 4p x 10-7 W/A-m. is the permeability of free space.
- Gas pressure (or energy density) Pg = nkT
- Magnetic pressure (or energy density) Pmag = B2/2m0
- Ratio is an important quantity called plasma beta: b = nkT / B2/2m0
If the gas pressure is greater than the magnetic pressure (b > 1, a high-beta plasma), the gas will control the structure of the atmosphere. If the magnetic pressure is greater than the gas pressure (b < 1, a low-beta plasma), the magnetic field will control the structure. The study of the interplay between magnetic fields and fluids is called magnetohydrodynamics or MHD.
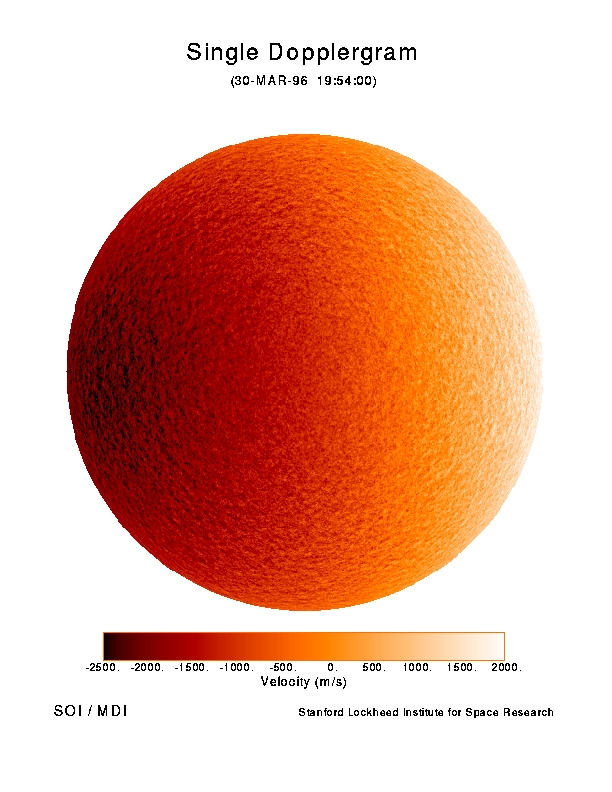
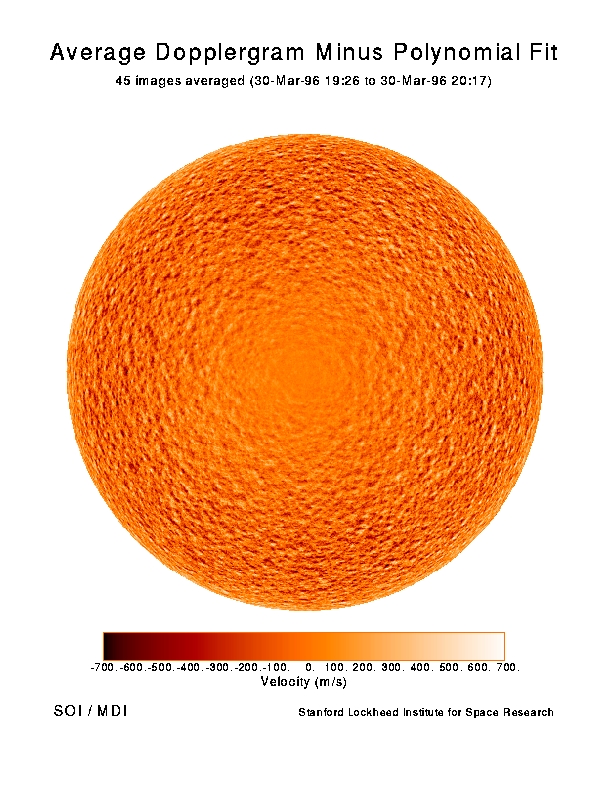
The interior (and surface, or photosphere) of the Sun is normally a high-beta plasma. That means the magnetic field can be pushed around by the fluid. However, magnetic fields are like unbreakable ropes, or rubber bands. They get wound up tighter by the fluid until the magnetic field strength becomes so great locally that Pmag ~ Pg, and after that they are not easily pushed around by the plasma. At the surface,this interplay between plasma motion and magnetic field is seen in sunspots, granulation, and supergranulation. Velocity images (dopplergrams) with solar rotation and supergranulation, with solar rotation removed, with both rotation and supergranulation removed .
 |
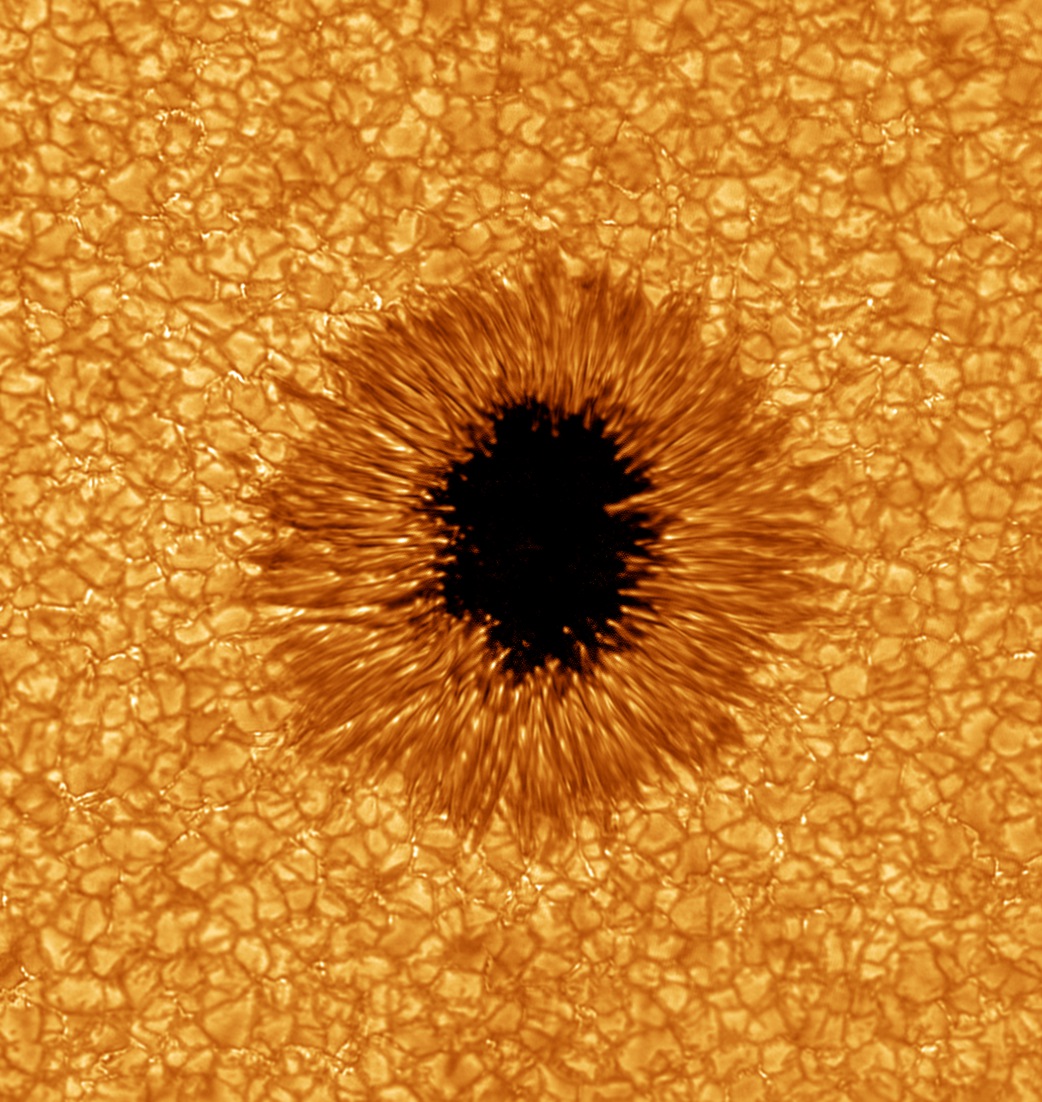
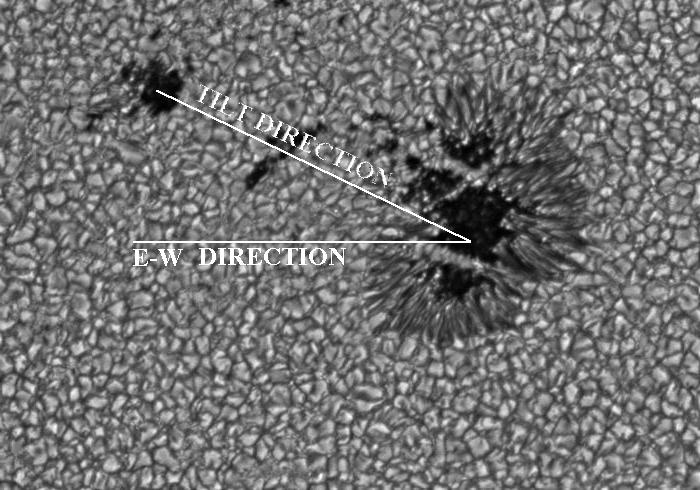
Sunspots: Areas of high magnetic field strength where electric currents have been concentrated by fluid motions inside the Sun until the magnetic pressure equals the gas pressure. The high field strength inhibits convection, and hence heat flow, into the spot, so the spot is much cooler (4500 K) than the surrounding photosphere (5770 K). That is why spots appear much darker than the photosphere, but in fact they are not dark--they would glow quite brightly if seen against a dark background. |
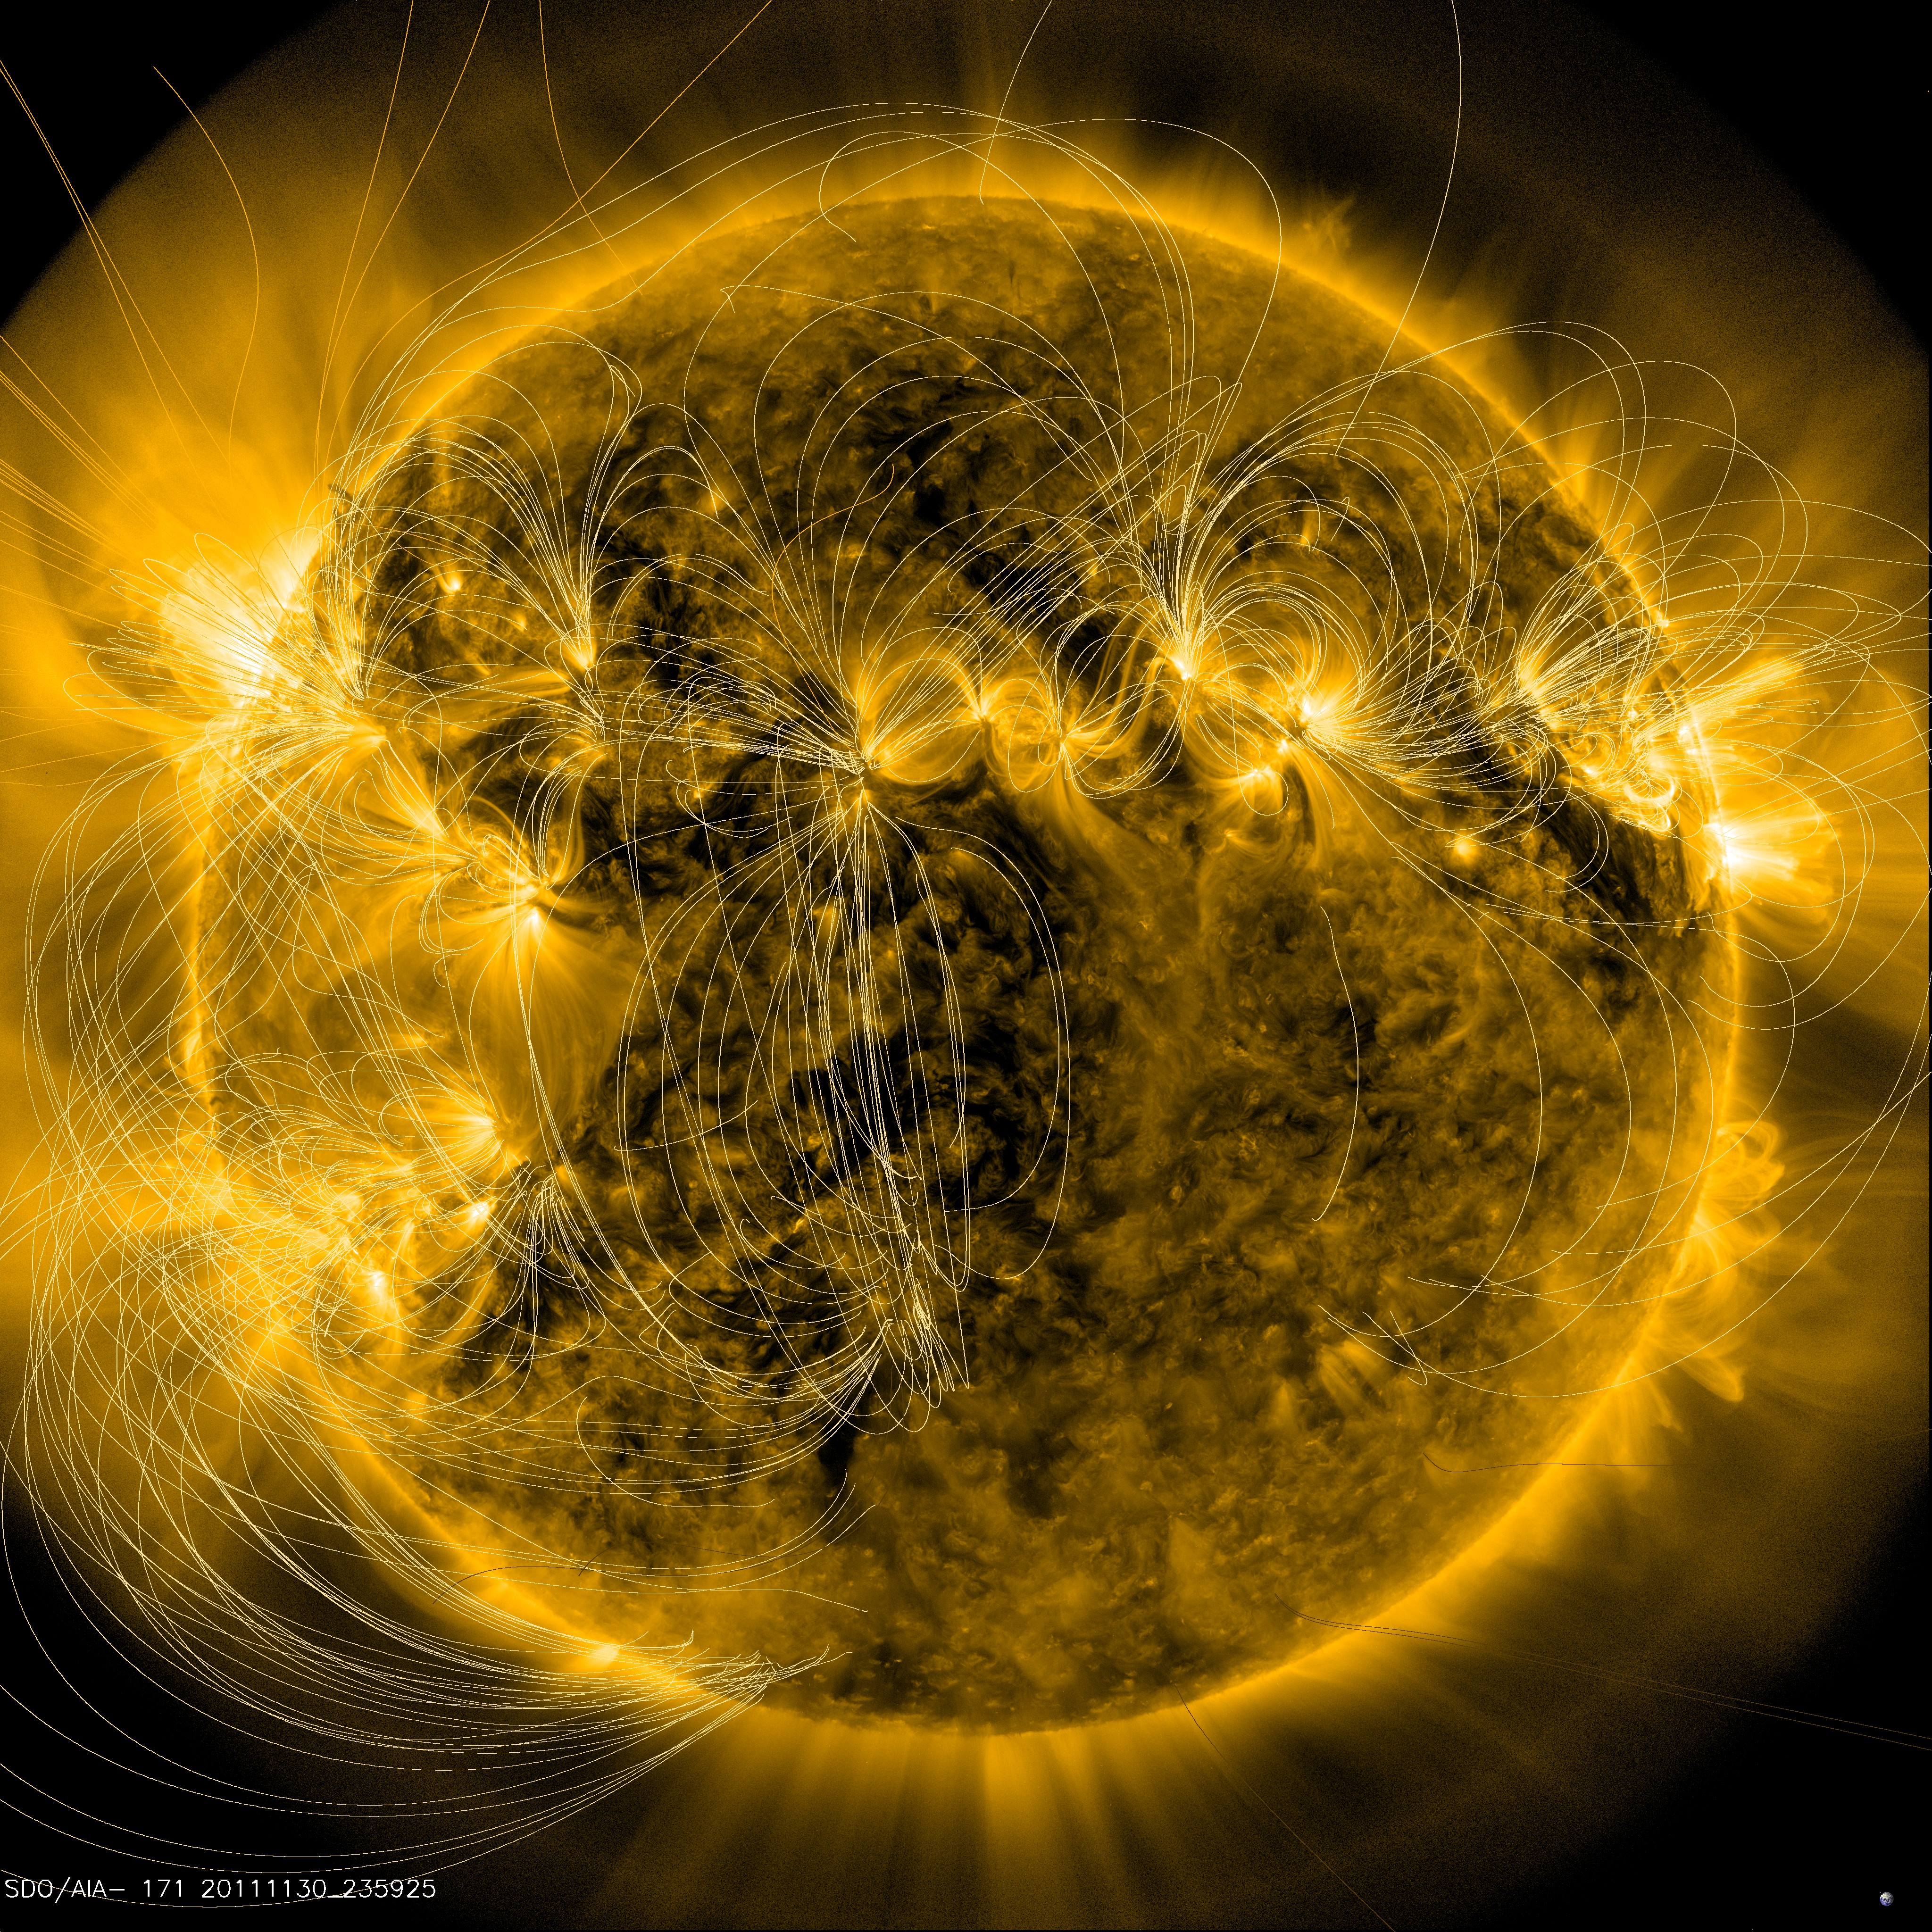
The corona of the Sun is a low-beta plasma. That means the magnetic field is in control, which explains why the corona is full of magnetic loops. The low density material in the corona has to follow the magnetic field lines.
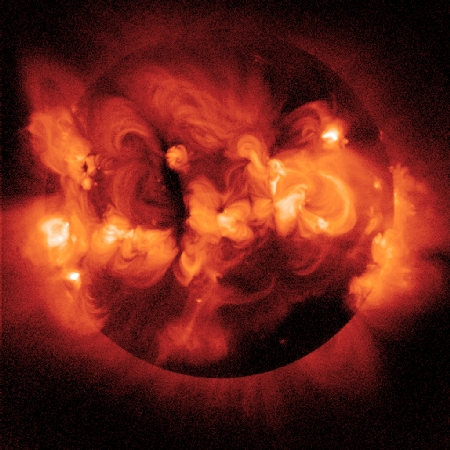 |
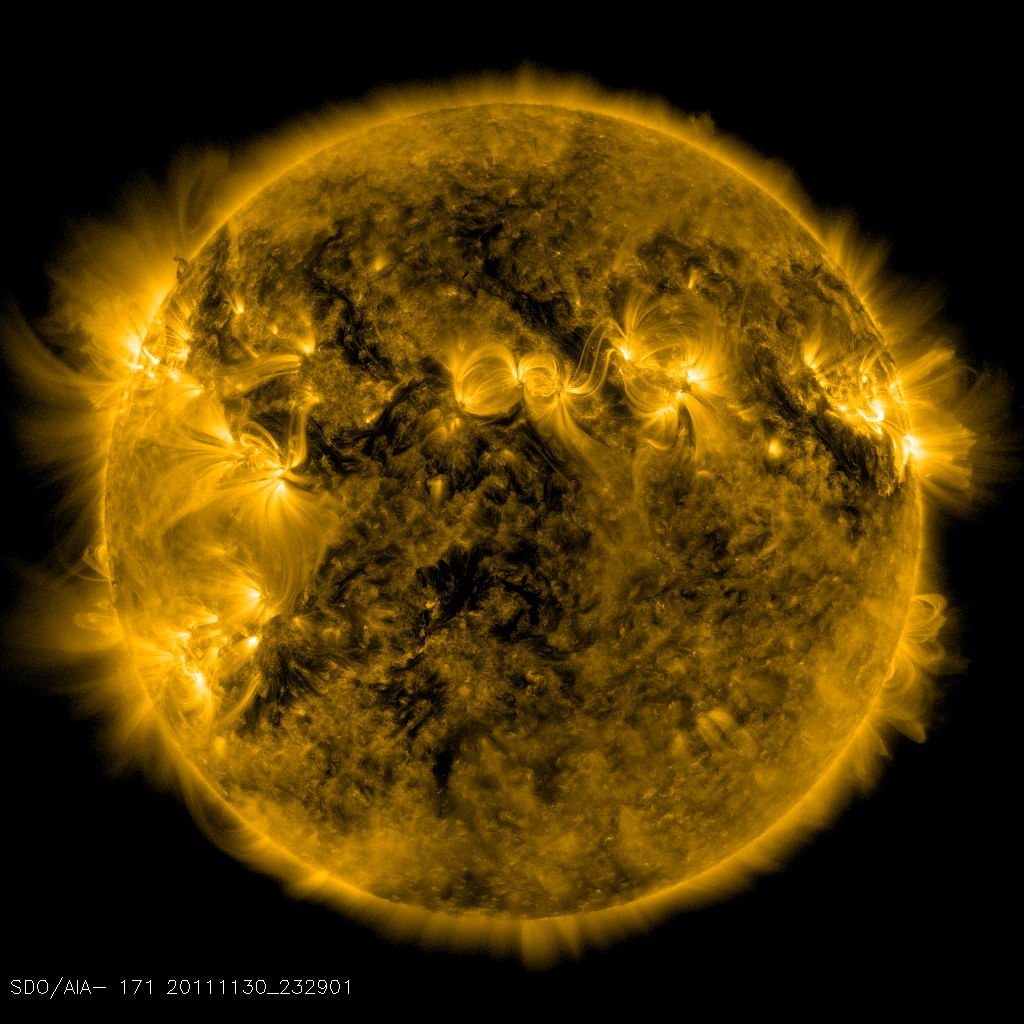
Corona in X-rays: The solar corona has a low gas density, but relatively high magnetic field strength emanating from sunspots. Here the magnetic pressure is greater than the gas pressure, so magnetic loops dominate the structure. The magnetic fields are a source of stored energy, and the release of that energy makes the corona so hot that it shines brightly in X-rays, especially in regions of especially strong magnetic fields. |