Physics 321 |
|
Prof. Dale E. Gary
NJIT |
Interaction of Light and Matter
Spectral Lines
We have seen how a blackbody spectrum is related to the temperature of a body. This smoothly varying spectrum is called a continuum spectrum because it is made up of all possible frequencies. Spectral lines, on the other hand, are narrow features superimposed on the continuum spectrumDoppler Shift
- Spectral lines are seen when light is passed through a slit, then expanded into a spectrum. A device for doing this is called a spectroscope.
- Absorption lines are dark lines due to "missing" frequencies
- Emission lines are bright lines due to extra emission at some frequencies
- Glowing gas shows emission lines, but if you put this same gas in front of a bright source of light, the same lines appear in absorption.
- For gas of different composition, the spectral lines appear in different places, unique for each element.
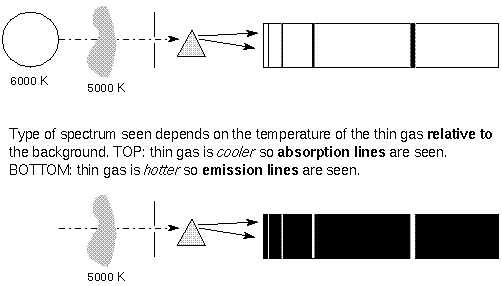
Spectral Lines and the Blackbody Spectrum
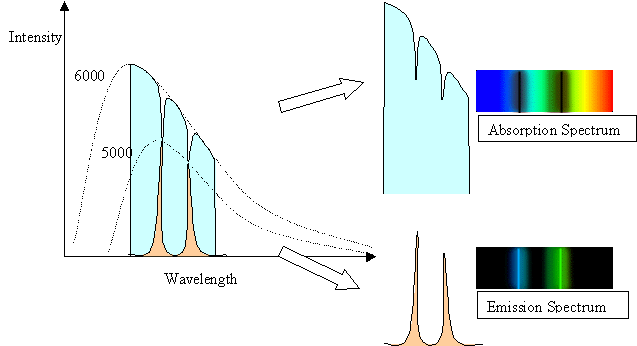
The spectral line intensities are related to the temperature of the body doing the emitting. In the case of the
5000 K gas in front of the 6000 K background, the background has a normal Planck Function blackbody
spectrum except where the cooler gas is absorbing it. The depth of the lines reflect the 5000 K blackbody
spectrum of the gas. In the case of the 5000 K gas with a cool background, the height or intensity of the
spectral lines reflects the 5000 K blackbody curve of the gas, but only in the spectal lines. At other wavelengths,
the gas has no emission, and so is dark.Measuring Spectra
Spectra are measured in wavelength, either in angstrom (1 A = 10-10 m), or nanometer (1 nm = 10-9 m) units. The use of nm is more common in scientific literature, but angstroms are used often in ordinary speech. Visible light ranges from about 4000 A (blue) to 8000 A (red), or 400 nm - 800 nm. We can convert any wavelength to frequency using the fact that the wavelength times the frequency equals the wave speed. For light, that means ln = c. The frequency of 500 nm light isn = c/l = 3 x 10⁸ m/s / 5 x 10⁻⁷ m = 6 x 10¹⁴ Hz.Converting a wavelength shift to a change in frequency is a little trickier. A wavelength shift of 0.1 nm (1 A) at 500 nm corresponds to a frequency shift ofDn = n - n0 = c/l - c/l0 = c/l02 (l0 - l) = - c/l02 Dl
= - [3 x 10⁸ m/s / (5 x 10⁻⁷ m)2] 0.1x10⁻⁹ m = -1.2 x 10¹¹ Hz.
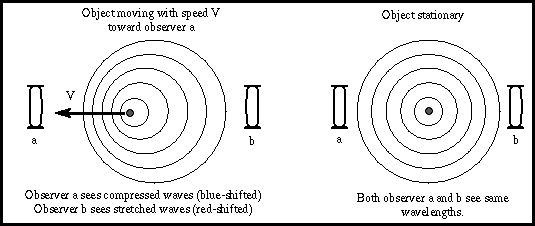
When an object making a sound moves toward you, the wavelength of the sound becomes shorter (the pitch becomes higher) due to the motion. As it moves away, the wavelength becomes longer (the pitch becomes lower). This familiar effect also happens with light. The effect is easy to understand graphically, due to the bunching up of waves in the direction of motion and the separation of the waves in the opposite direction, as shown in the following figure.Light from an approaching object thus appears blue shifted, while light from a receding object appears red shifted. The amount of blue or red shift is easily calculated when the velocity of the object is small.
Since lo = c / n for a stationary source (lo is the rest wavelength), then a source moving away from us with speed vr has a wavelength
l = (c + vr) / nso the fractional wavelength shift isDl/lo = (l - lo)/ lo = [(c + v) / n - c / n] / (c / n) = vr /cThat means we can easily measure the radial speed, vr, of an object from this fractional wavelength shift. The existence of spectral lines make this very easy, since they give nice markers for wavelengths in the spectrum. For an approaching object, by the same steps we find that Dl/lo = - vr /c.
Note that even small (milli-angstroms) shifts of spectral lines are measureable, and any object whose spectrum shows spectral lines can have its radial velocity measured. This measurement does not depend on distance! So even the most distant galaxies can have their velocities measured so long as they have lines in their spectrum.Photoelectric EffectWhen the velocity of approach or recession nears the speed of light (v->c), a relativistic version of these expressions must be used, where:
l = lo [(1 + vr /c)/ (1 - vr /c)]1/2Vega Example: One of the most important spectral lines is the hydrogen-alpha (Ha) line, which we will introduce next time. This spectral line has a rest wavelength, lo, of 6562.80 angstroms (A). The Ha absorption line in the spectrum of the star Vega is measured at 6562.50 A. What is its radial velocity?
n = no [(1- vr /c)/ (1 + vr /c)]1/2Dl/lo = (l - lo)/ lo= (6562.50 - 6562.80)/6562.80 = -4.57 x 10-5 = vr /cThe minus sign indicates that Vega is moving towards us. Note that this is only the average position of the Ha line, in reality it moves back and forth every 6 months due to the Earth's orbital motion (29.8 km/s) around the Sun.
vr = -7.62 x 10⁻⁵ c = -13.7 km/s
We already discussed how the work of Max Planck on the expression for the blackbody spectrum (the Planck function) imply the existence of photons, whose energy is E = hn. This theoretical existence of photons was verified experimentally by the photoelectric effect (by Albert Einstein). Electrons in a metal are held to the surface by an electrostatic force from the ions of the metal. Light shining on the metal can be absorbed by these electrons, causing them to escape where they can be measured. It was found experimentally that the electrons were emitted with a range of energies when light shines on the surface, but those originating closest to the surface have the maximum kinetic energy, Kmax. However, the value of Kmax did not depend on the intensity of the light. A brighter light will release more electrons, but Kmax does not change. However, Kmaxdoes change with the frequency of the light. Einstein's explanation was that the higher frequency light consisted of higher energy photons, which were absorbed by the electrons and caused them to escape with higher energy.Atomic Structure
Much of our information about the stars and other objects in astronomy comes from clues in the spectrum of the starlight, especially spectral lines. To understand the origin of spectral lines, we must examine the internal structure of the atom. In particular, we will start with a simplified model called the Bohr model of the atom, since it gives surprisingly good results despite its rather extreme over-simplification. Bohr set out to explain
- location of spectral lines of hydrogen (Balmer series)
- Johann Balmer measured the wavelengths of this series of lines from atomic hydrogen and found that they fit the relation
1/l = RH ( 1/4 - 1/n2)
where RH is the Rydberg constant RH = 10.96776 mm-1.- Using n = 3 gave the Ha line wavelength, n = 4 gave Hb, and so on.
The hydrogen line spectrum, with the pattern of Balmer lines that Bohr set out to explain.