We now discuss one of the
most important diagrams in Astronomy, a way of organizing and presenting
information about all of the various kinds of stars, with which we can
instill order from the cosmos and understand the internal workings of the
stars even though we see most of them as a mere point of light. You
have all taken some simple measurements of nearby stars -- the B-V
color index and the absolute magnitude (which required measurements of
apparent magnitude and trigonometric parallax) -- and made for yourself
a Hertzsprung-Russell or H-R
diagram. The same diagram can be presented in different, but equivalent
ways:
-
MVvsB-V
(the kind you made, called a color-magnitude
diagram)
-
MV vs
Spectral Type
-
Luminosity vs Temperature
(L-T diagram -- a theorist's diagram)
The first thing we note
is that the stars tend to fall in a fairly narrow band, stretching diagonally
across the diagram. This band is called the main
sequence, because most stars (between 80 and 90% of all stars)
lie along it.

Figure 6.1 H-R Diagram of Stars Within 25 pc of the Sun
Clearly the bluer stars (zero
or negative B-V)
tend to have higher absolute magnitudes, while red stars (large positive
B-V)
have lower absolute magnitudes. Remember that we can convert absolute
magnitude to luminosity, through the equation
Msun -M*
= 2.5 log L*/Lsun
where the magnitudes are bolometric
magnitudes, after applying the bolometric correction. Likewise, we
can convert color index to temperature (approximately) according to
CI = B - V = -0.865
+ 8540 / T (4000 K < T < 10000 K)
and similar conversions can
be made for other temperature ranges. In this way, we can change
from the color-magnitude diagram based on observation to the luminosity
vs
temperature diagram based on physics.
We can ask what causes the
relationship we see between luminosity and temperature. We know that
these two are related by
where R*
is the radius of the star, and s
is the Stefan-Boltzmann constant. If all stars are the same size,
the H-R diagram would show just such a variation, with blue stars appearing
brighter than red stars just due to the T 4
increase in blackbody flux output. However, the main sequence is
much steeper than this, and cuts across lines of equal stellar radii, as
you can see in the figure below. The stars must actually get larger
as they get bluer, or more correctly, they must get bluer as they get larger.
This is a powerful clue as to how stars work.
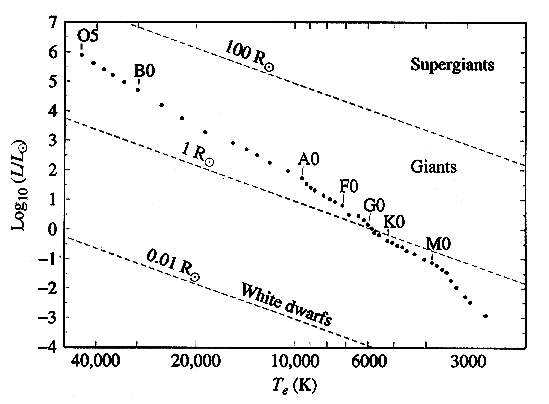
Figure 6.2 HR diagram with lines of constant stellar radius
superimposed.
In addition to the stars
that lie on the main sequence, Figure 6.1 shows a few stars off the main
sequence, both above and below. The ones below must have a smaller
size than ones on the main sequence at the same color index. The
ones above must have a larger size. Note that the ones above tend
to be red (cool), while the ones below tend to be blue-white (hot).
These are, not surprisingly, called red giants and white dwarfs, respectively.
Note that once we plot a star on an L-T diagram, we know its radius.
We find
-
Main sequence stars range in
size from 0.08 Rsun
at the cool, red end (M stars) to about 60 Rsun
at the hot, blue end (O stars).
-
White dwarfs are at 0.01 Rsun
or smaller.
-
Red supergiants can reach 300
Rsun or
even larger.
We have used the
terms giant, supergiant, dwarf, without defining them. Because of
the relationship between size and luminosity, the size categories correspond
to luminosity class. The Morgan-Keenan
(M-K) system is based on spectra. One can see subtle differences
in spectra of stars of otherwise similar spectral type, due to the different
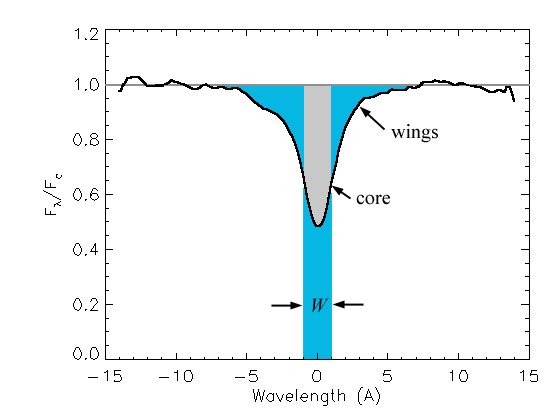
sizes of the stars. One of the main effects is the width of the spectral
lines, which get narrower for more luminous stars, as may be seen below:

Figure 6.3 Spectra near spectral type F5, for different luminosity
classes
Adapted from data in the
electronic version of "A Library of Stellar Spectra,"
by Jacoby G.H., Hunter D.A.,
Christian C.A. Astrophys. J. Suppl. Ser., 56, 257 (1984).
The M-K system of luminosity
classes are shown in the table below, and their position on the H-R diagram
is shown in Figure 6.4, below.
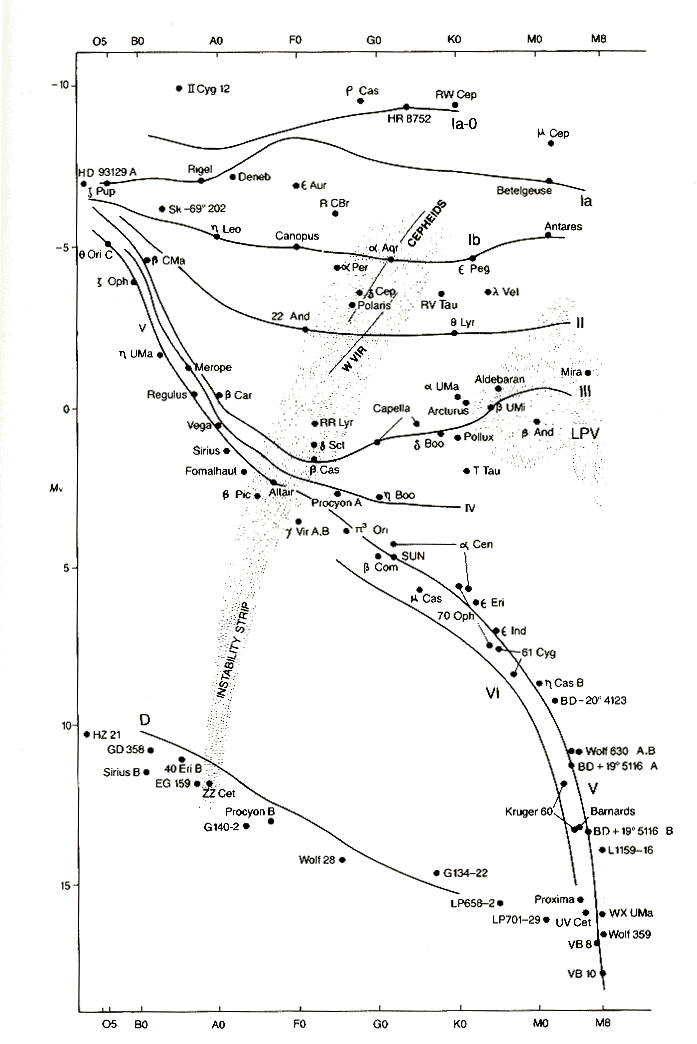
Figure 6.4 An H-R diagram showing the Morgan-Keenan luminosity
classes,
along with locations in the diagram for some nearby or bright stars.
|
Class
|
Type of Star
|
|
Ia-O
|
Extreme, luminous supergiants
|
|
Ia
|
Luminous supergiants
|
|
Ib
|
Less luminous supergiants
|
|
II
|
Bright giants
|
|
III
|
Normal giants
|
|
IV
|
Subgiants
|
|
V
|
Main-sequence (dwarf) stars
|
|
VI
|
Subdwarfs
|
|
D
|
White dwarfs
|
The M-K classification scheme
enables astronomers to place a star on the H-R diagram solely on the basis
of the star's spectrum. Once the star is placed on the H-R diagram,
one can simply read off the absolute magnitude MV
from the vertical scale, and from its measured apparent magnitude find
its distance from
mV -
MV = 5 - 5 log
d
Such a distance determination
is called spectroscopic parallax, although
note that it has nothing to do with parallax. It is simply
a distance determination based on its spectral type. Note that because
the luminosity classes are of finite extent in magnitude, this method is
only good to roughly +/- 1 magnitude, which corresponds to a distance accuracy
of about 101/5 = 1.6.
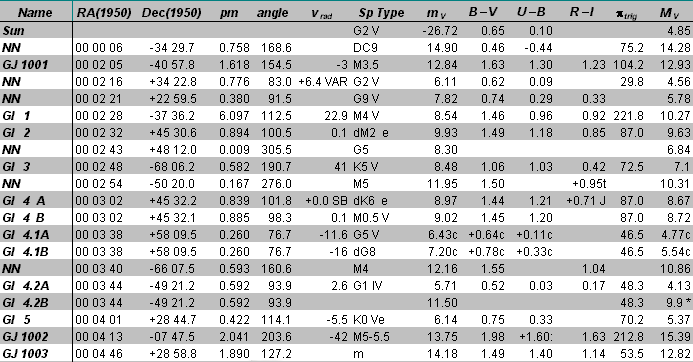
Let's compare spectral types
from our catalog with the listed absolute magnitudes. Star Gl 3 is
listed as a K5 V (a K5 main-sequence, or dwarf star), and looking up that
spectral type in Table A4.3 of the text, we find a predicted absolute magnitude
of 8.0. The absolute magnitude listed above is 7.1 -- somewhat brighter
than predicted. The star GJ 1003 has a listed spectral type of 'm',
which must mean that the spectral type is uncertain, but it is some type
of M star. If we assume that it is luminosity class V, then from
its measured absolute magnitude of 12.82 we would predict that it should
be somewhere between M5 and M6. Its B-V
color index, however, would place it as about M2 or M3. You can see
that Table A4.3 is not exactly precise, but it makes a useful guide.
The total line shape is
the sum of these three effects (plus some other effects such as stellar
rotation or pulsations, which do not have simple expressions). The
total line profile is called a Voigt profile.
Doppler widths contribute mostly to the line core
(see the figure above) while pressure effects contribute more to the line
wings.
In addition, the line profile
changes depending on the number of atoms per unit area, (column density)
Na
contributing to it. For the H-alpha line, this would be the number
of H I atoms along the line of sight that are in the n =
2 state. Here is the behavior as the
column density Na
grows:
-
The line grows deeper, and the
equivalent width grows linearly with Na.
-
Ultimately the core of the line
saturates.
At this point the wings continue to grow deeper and broader, but the core
gets flatter. The equivalent width now grows much more slowly, as
(lnNa)1/2.
-
As the wings grow deeper, the
pressure-broadening grows more important and the equivalent width grows
more quickly again, but still not as quickly as at first, going as Na1/2.
It is possible to draw
a curve of growth that expresses how
the equivalent width log W/l
changes with log f Na(l/5000).
This is shown for the Sun in the figure below. Here, f
is
the oscillator strength for the transition,
and is a value tabulated for each electron transition in an atom that expresses
the relative likelihood of that transition occurring rather than another
from the same initial energy level.
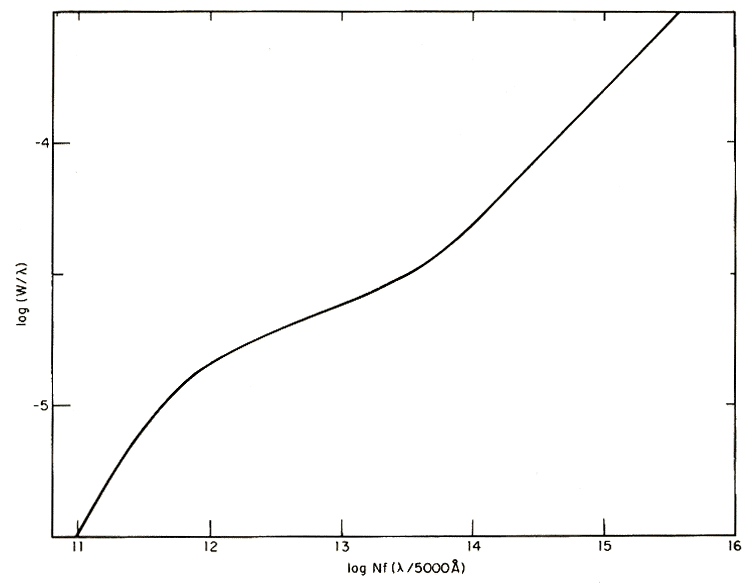
A general curve of growth for the Sun, where N is in atoms/cm2.
(Figure from Aller, Atoms, Stars, and Nebulae,
Revised Edition, Harvard University Press, Cambridge, MA, 1971).
Example:
We will use the above curve
of growth to find the number of sodium atoms above each square centimeter
of the Sun's surface from measurements of two sodium lines given in the
first two columns of the table below. The third column is the oscillator
strength f measured in the laboratory,
and the last two columns are just combinations of the first three columns,
for calculation convenience below.
|
l (A)
|
W (A)
|
f
|
log (W/l) |
log[f (l/5000 A)] |
|
3302.38
|
0.088
|
0.0214
|
-4.58
|
-1.85
|
|
5889.97
|
0.730
|
0.645
|
-3.90
|
-0.12
|
Values of the Sun's surface
temperature T = 5800 K and pressure P = 0.01 N/m2
were used to construct the above curve of growth, and will be used in this
example.
Both of the lines are produced
when an electron makes an upward transition from the ground state of the
neutral sodium atom (Na I) and so they both have the same value of Na,
the number of absorbing sodium atoms per unit area above the surface.
This number can be read from the figure, using the values in the table,
to obtain the value of log[f Na(l/5000
A)] for each line. The results are:
log[f Na(l/5000
A)] = 13.20 for the 3302.38 A
line
= 14.83 for the 5889.97 A line
To obtain the value of
the number of absorbing atoms per unit area, Na,
we use the measured equivalent widths, in the form of the last column of
the table, log[f (l/5000 A)],
together with
log Na
= log[f Na(l/5000
A)] - log[f (l/5000
A)]
= 13.20 - (-1.85)
= 15.05 for the 3302.38 A line
= 14.83 - (-0.12)
= 14.95 for the 5889.97 A line.
The average value of
log
Na is
thus 15.0, so there are about 1015
Na I atoms in the ground state per cm2 area
of the Sun's surface.
To find the total number
of sodium atoms, we use the Boltzmann and Saha equations from the previous
lecture. The difference in energy between the final and the initial
states, Eb -Ea,
is just the energy of the emitted photon, so in the Boltzmann equation
exp[-(Eb
-Ea)/kT]
= exp[-hc/lkT]
= 5.45 x 10⁻⁴
for the 3302.38 A line
= 1.48 x 10⁻²
for the 5889.97 A line.
and so nearly all of the neutral
Na I atoms are in the ground state. All that remains is to determine
the number of sodium atoms per unit area in all stages of ionization.
If there are NI = 1015
neutral atoms, then the number of singly ionized atoms, NII,
comes from the Saha equation:
| NII |
|
2kTZII
|
( |
2pmekT |
) |
|
= |
|
|
exp(- cI/
kT
) |
| NI |
|
PeZI
|
h2
|
|
Using atomic parameters
for
Na, ZI = 2.4,
ZII=
1.0 (partition functions), and cI=
5.14 eV for the ionization potential, the
above equation evaluates to NII/NI=
2.43 x 10³.
This means that there are about 2430 singly-ionized sodium atoms for every
neutral atom, so NII = 2.43
x 103 NI =
2.43 x 1018 cm-2.
Where
to find atomic data (ionization
potentials, oscillator
strengths)


