| Physics 728 |
Radio Astronomy: Lecture #4
|
Prof. Dale E. Gary
NJIT
|
Primary Antenna Elements
Introduction
The antennas of
an array have two main purposes:
-
to intercept, or collect, the
radiation and direct it to the receiver
-
to restrict the field of view
The first function of the primary
element can be expressed in terms of the antenna effective
area, A(ν, θ, φ),
in units of m2,
where θ, φ
are direction coordinates on the sky. If the brightness of a source
is I(ν, θ, φ) in
W
m−2 Hz−1
ster−1,
then the power collected, in W, is
found by integrating over solid angle
ΔΩ
and bandwidth
Δν and multiplying by the collecting area:
| P = A(ν, θ, φ) |
I(ν, θ, φ) ΔΩ |
Δν |
|
|
|
|
|
|
flux density
|
|
(W m−2
Hz−1) |
|
|
|
|
flux
|
(W m−2) |
Associated with the collecting
area (effective area) is the beam pattern,
also called the primary beam,
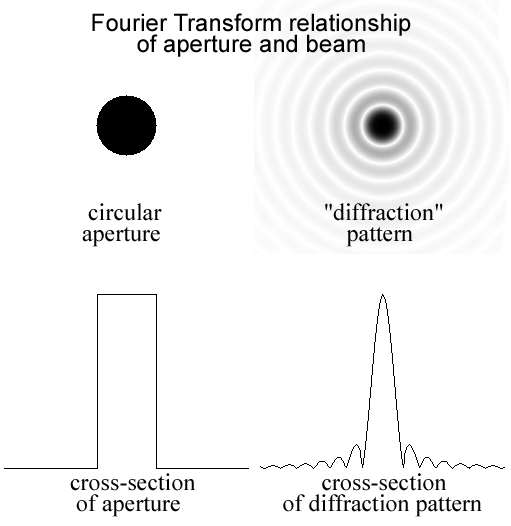
which is just the Fourier Transform
of the aperture, as shown in the figure below.

Figure 1.
We will come back to the
primary elements, and the beam pattern, or primary beam, shortly.
But first, let's take a closer look at Fourier Transforms.
Fourier Transform Relationship
and Inverse
This is the first
time we have explicitly met the Fourier Transform relationship, but since
it occurs over and over in radio astronomy, it is worthwhile to look at
it in some detail, in particular the Fast Fourier Transform. You are encouraged to experiment
with the FFT function in IDL (Interactive Data Language), Python, or other scientific computing package you may have.
Given two spatial coordinates, x,
y, in m,
say, we consider the corresponding spatial
frequencies, u, v,
in wavelengths, defined as u = x/λ,
v = y/λ.
Then F(l,m) is the fourier
transform of f(u,v):
|
  |
|
2pi(ul + vm) |
|
| F(l,m) = |
f(u,v) e |
|
du dv |
|
aperture |
|
|
where
-
f(u,v) = complex voltage distribution in the
aperture (Fig. 1, upper left, assumes a flat plane wave)
-
F(l,m) = complex far-field voltage radiation
pattern, with l,m = angular distances on the sky (pattern is shown
in Fig. 1, upper right)
The inverse is written as
|
  |
|
−2πi(ul
+ vm) |
|
| f(u,v) = |
F(l,m) e |
|
dl dm |
|
all sky |
|
|
and you would perform this
inverse with the FFT by using fft(F, −1) (ifft2 in Python) where the −1 indicates the inverse
Fourier Transform. Note that the definition of the IDL FFT (and others) defaults to −1, so fft(F) = fft(F, −1). If you want the forward transform, you will have to do fft(F, 1).
We are going to use Fourier
Transforms further in discussing the response of pairs of antennas (interferometer
baselines), which we will do in Lecture 6. Let's go ahead and introduce
that now. A pair of antennas measures one point in the u,v plane,
and the Fourier Transform of this point gives the familiar interference
fringes on the sky.
These relationships are shown
graphically in the figure below:

A point in the u,v
plane a distance s from the origin has components u and v.
In radio astronomy, this
corresponds to a single baseline, or pair of antennas.
The FT of this sampling
corresponds to fringes in the sky plane, with angular
separation θ
= fringe spacing. The two corresponding angular coordinates are
θl
and θm,
which are the fringe separations in the l
and m angular
directions.
The following terminology
is used
s = (u2
+ v2)1/2
= spatial
frequency
s−1
= θ = fringe spacing
u = "x-component" of s
v = "y-component" of s
When we use FFT's, of course,
we must pixelize, or grid, the data into 2-d arrays that the computer can
deal with. The first step, then, is to pick a pixel size for the
u,v plane. Let's look
at the antenna aperture problem, and consider an antenna of 6 m aperture.
Note that we also have to know what frequency (wavelength) we want to consider.
At 5 GHz, the wavelength is 6 cm, so 6 m is 100 wavelengths (we can say
that the dish diameter is Dλ
= 100). We might choose a pixel
size corresponding 1 wavelength, so that our aperture will occupy a circle
of radius 50 pixels (diameter 100 pixels). After we do the FFT, what
is the corresponding pixel size in the sky plane (also called the map)?
If you step into the first
pixel in the u,v plane, this
corresponds to one cycle (one fringe) fitting across the entire map.
The second pixel corresponds to two cycles fitting across the map, and
so on. We said the fringe spacing was s-1,
so stepping one pixel (s = Δs)
yields a fringe spacing of θ = NΔθ = 1/Δs (radians), where N is the number
of points in the array. Thus, for a u,v array of 256 points, with each pixel in the array representing 1 wavelength,
we will have each pixel in the map corresponding to
Δθ = (NΔs)−1 = 1/256 radian = 13.4 arcmin.
So how many pixels should the
beam be? We said in the first lecture that the beam was θ ~ λ/D = 1/Dλ,
which is 0.01 radian, or 35 arcmin, so the beam will occupy less than three
pixels! Here is the result:

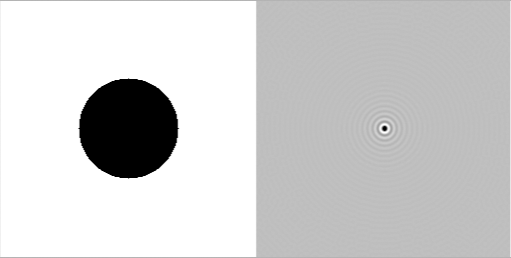
ap = float(dist(256) le 50.) beam = fft(ap) [IDL]
ap = (dist(256) <= 50.).astype(float) beam = ifft2(ap) [Python]
The IDL and Python commands used to
create the above two images, are shown
just below each image.
So to see the beam shape
in better resolution we have two choices--use a larger Δs,
or use a larger array (larger N).
Here is the result using array size of 1024:
It may seem paradoxical that
we can put the same size circular aperture into a larger array full of
blank space, and get a higher resolution view of the beam shape, but that
is the way it works. Note that we have the following useful relations:
Δθ = (NΔs)−1
(relation between pixel sizes in the two planes)
NΔθ = Δs−1
(relation between map sizes in the two planes)
These are symmetrical:
Δs = (NΔθ)−1
(relation between pixel sizes in the two planes)
NΔs = Δθ−1
(relation between map sizes in the two planes)
Note also that the smallest
fringe spacing possible is one in which every other pixel is a peak (i.e. N/2 fringes across the map).
This is the Nyquist frequency, and corresponds to the largest useful distance
in the u,v plane, e.g. u
= N/2. If you try to go beyond u
= N/2, the point "wraps around" and becomes u = −N/2.
Back to the Primary Beam
The "power pattern"
of a single dish telescope is |F(l,m)|2,
i.e., the beam pattern is the square of the complex far-field voltage pattern,
|F(l,m)|2 =
F(l,m)F*(l,m).
Here is a plot of the angular pattern:
 where you can see the main lobe
and the side lobes. This pattern is, of course, azimuthally symmetric.
The dish is maximally sensitive to radiation from the direction of the
peak of the beam, but is also slightly sensitive to sources in the side
lobes. If we write A(ν, θ, φ) for the collecting area, as before, then we can normalize to the peak value
on-axis, A(ν, 0, 0) = Ao and consider the normalized beam pattern A(ν, θ, φ) = A(ν, θ, φ) / Ao.
Then the beam solid angle is
|
  |
|
| ΩA
= |
A(ν, θ, φ) ΔΩ |
|
all sky |
Directivity
An isotropic antenna would
have solid angle ΩA = 4π.
The directivity (also called
the gain of the antenna) is
defined as the ratio of peak radiation intensity to average radiation intensity
D = 4π / ΩA
so a highly directive antenna
has a small ΩA.
Collecting Area vs. Physical
Area
Ao
is the collecting area when pointed directly at a source, yet this may
not be the same as the physical area of the aperture. The ratio can
be used to define an aperture efficiency η
< 1
Ao = ηA
which takes into account a variety
of losses. We will come back to this shortly.
A fundamental relationship
between Ao and ΩA is
AoΩA = λ2
which shows that as Ao gets bigger, ΩA gets smaller (D = directivity increases).
Antenna Types
At wavelengths below ~ 1
m (300 MHz), simple wire antennas (e.g. dipoles, yagis, spirals, etc.)
can be used. Note that we can define
the collecting area of a dipole as
Ao
= λ2/ΩA
and use the dipole radiation
pattern, proportional to sin2θ to determine ΩA.
Other combinations, such as a yagi antenna, have a different radiation
pattern, but the relationship can still be used.
At short wavelengths, wires
give too small a collecting area, so reflecting surfaces are used.
We will concentrate on reflecting dishes from here on. A useful rule
of thumb is that when the wavelength grows so large that
a dish is less than 5 wavelengths in diameter, the dish is no longer competitive
with the same size dipole. That means a 2 m dish, for example, is
only effective to wavelengths shorter than 40 cm => frequencies higher
than 750 MHz.
See Napier
lecture for examples of types of antennas.
Antenna Performance
Aperture Efficiency
As we said a moment ago,
the aperture efficiency Ao = ηA is
made up of several factors. In general, we can write the efficiency
as the product of several factors
η = ηsf ηbl ηs ηt ηmisc
where
ηsf
= reflector surface efficiency
ηbl
= reflector blockage efficiency
ηs
= feed spillover efficiency
ηt
= illumination efficiency
ηmisc
= losses due to reflector diffraction, feed position errors, feed mismatch,
and others
See Napier
lecture for discussion of reflector surface efficiency.
Aperture Blockage Efficiency
Many antenna designs (prime
focus and cassegrain), require structures to hold the feed and/or subreflector
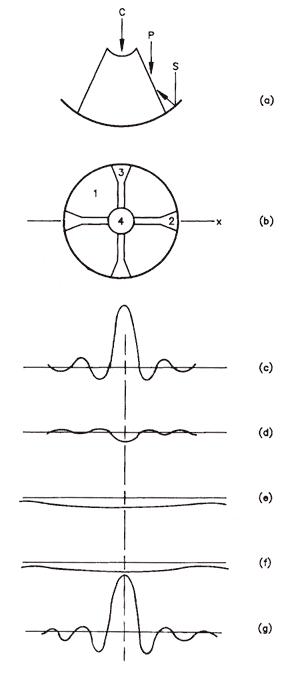
in place, and these structures block part of the aperture. The situation
is shown in the figure below, and can be analyzed by considering different
parts of the structure separately, e.g. regions 1, 2, 3 and 4 in (b), and
doing the Fourier Transform of each part. Thus, (c) is the FT of
the unblocked aperture, (d) is the FT of part 2 (shown negative because
it is a blockage), (e) is the FT of part 3, also negative, (f) is the FT
of part 4, and finally (g) is the sum of the FT's. The reason one
can separately treat each part is because the
FT procedure is linear. This is a very important property
that we will use several times in the course.
 The efficiency due to blockage
is
ηbl = (1 − area blocked/total area)2 ~ (1 − 2*area blocked / total area) for small blocked / total.
Note that the blockage affects
the beam shape in addition to the aperture
efficiency. Some designs are off-axis to reduce or eliminate blockage
(but this may cause other unwanted effects).
Feed Spillover Efficiency
Consider the antenna as
a transmitter. For a prime focus antenna, spillover efficiency is
the fraction of radiated power intercepted by the reflector. Power
not intercepted is lost. Telescopes for radioastronomy often have F/D = 0.4, so the half-angle
that the dish presents as viewed from the feed is θR = atan 0.5/0.4 = 51o, so
the total width is about 100o.
Thus, we need a broad feed pattern to illuminate the dish. Note that
any spillover "sees" the ground in receiving mode, and that can increase
the noise temperature, which we will discuss later.
The situation is different
for a Cassegrain design, where the feed is at the reflector and the radiation
has to hit the subreflector (secondary). In that case, θR
is much smaller, so we need to use a more directive feed. In this
case, spillover "sees" the sky.
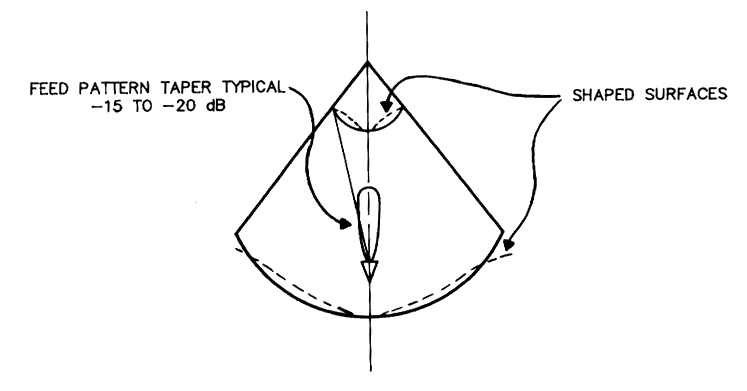
Typically, 0.7 <
ηs <
0.97, with the higher values requiring "shaped"
reflectors as in the figure below.

Illumination Taper Efficiency
We could certainly avoid
spillover in the above consideration by under-illuminating the dish so
that there is no chance that the radiation will miss the edge and go into
the sky or ground. However, underilluminating the dish means that
some of the collecting area goes unused (in receive mode, the feed does
not accept radiation from the edges of the underilluminated dish).
This is a loss of efficiency that is reflected in the illumination taper
efficiency factor. The goal is to evenly illuminate the dish all
the way to the edge (uniform illumination). To give an idea of the
magnitude of the effect, for a prime focus antenna with ~ 10 dB taper at
the edge, we have 0.7 < ηt
< 0.8. The shaped surfaces, above,
are used to provide uniform illumination, but note that this requires use
of two surfaces, properly shaped, so can only be used for cassegrain type
antennas. One can get close to unity in this factor with the use
of shaped surfaces.
Example of VLA performance:
|
λ
|
ηsf
|
ηbl
|
ηs
|
ηt
|
ηdiff
|
ηmisc
|
ηtot
|
ηmeas
|
|
20 cm
|
1.0
|
0.85
|
0.82
|
0.98
|
0.86
|
0.94
|
0.55
|
0.51
|
|
6 cm
|
0.97
|
0.85
|
0.92
|
0.98
|
0.96
|
0.94
|
0.67
|
0.65
|
|
2 cm
|
0.85
|
0.85
|
0.90
|
0.95
|
0.98
|
0.94
|
0.57
|
0.52
|
|
1.3 cm
|
0.68
|
0.85
|
0.90
|
0.95
|
0.99
|
0.94
|
0.46
|
0.43
|
The important lesson is that
even though the losses for any single term seem small, the cumulative effect
is that the dishes act as if they were only about 1/2 or less of their
actual, physical area. So the overall efficiency is difficult to
keep near unity!
For pointing accuracy and
polarization issues, see Napier
lecture.


