Phys 728, Spring 2012
Homework Problem Set #2
2.1. Show that radio recombination lines for He and C (recombining
from singly-ionized to neutral state) will be shifted by about 120 km/s
and 150 km/s, respectively, relative to the same line for H. (hint:
this is due to the dependence of the Rydberg constant on reduced mass.) Note that these velocity units come from interpreting wavelength shifts as doppler shifts, Dn = v/c, so first calculate the frequency (or wavelength) shifts and convert to velocity.
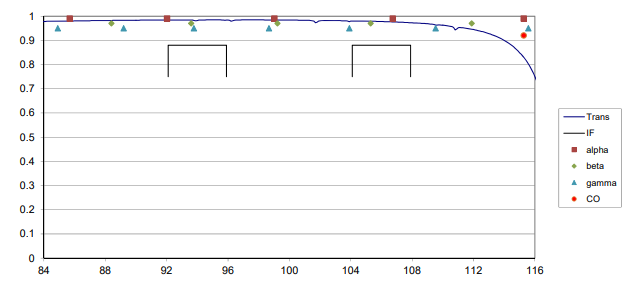
2.2 The ALMA mm/submm radio telescope is just starting to be used for solar observations. One question is whether radio recombination lines might be detected in the solar atmosphere by ALMA. Currently ALMA bands 3 and 6 have been tested for solar work. The receivers provide two intermediate frequency (IF) ranges for each band shown in the two figures below. Create a table for the 7 transitions within or close to each IF range, verify the transition frequencies, and label each transition, e.g. H25a. Give the expected line width in MHz. There is also a CO line in band 6. Which transition is this? *A possible class project is to use some of our ALMA data to look for signs of one or more of these recombination lines.
 |
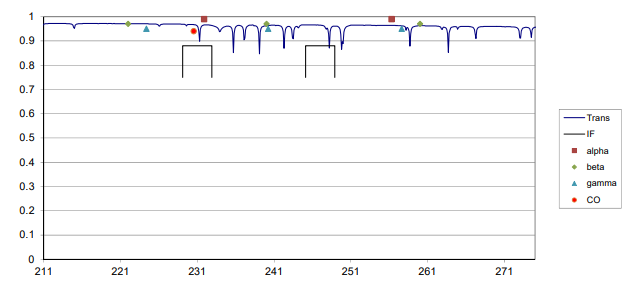 |
| Plot of ALMA bands 3 (upper) and 6 (lower), where the IF ranges (two for each band) are shown in black, and the frequencies of recombination line transitions are shown as squares (alpha transitions), diamonds (beta transitions), and triangles (gamma transitions). (From memo by Richard Hills.) |
2.3 Calculate the relative emissivities for the first three harmonics
of thermal gyroresonance emission, for a temperature of 106
K. For a temperature of 107 K. Note that you only
need relative emissivities, so use ratios so that some quantities cancel.
Assume that the index of refraction is unity, and use that fact that b2
= kT/mc2. Ignore the line-shape (i.e. calculate
it at line-center, n = snB).
2.4 Considering only the line-shape (exponential in the expression
for thermal gyroresonance emission), plot the line shape for the 2nd harmonic
for the two temperatures given above. Comment on the tendency as
temperature increases.