|
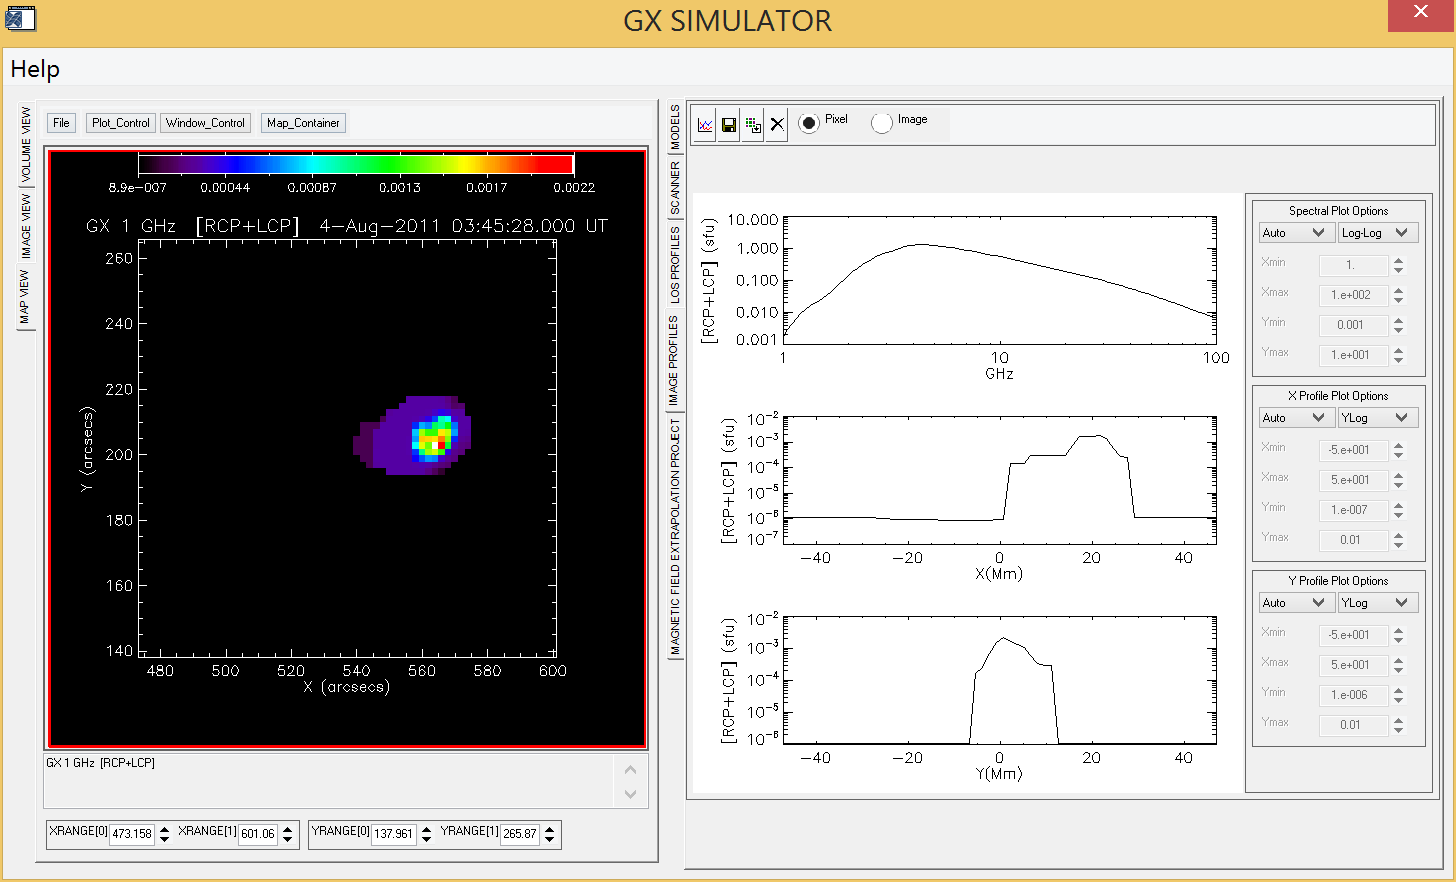
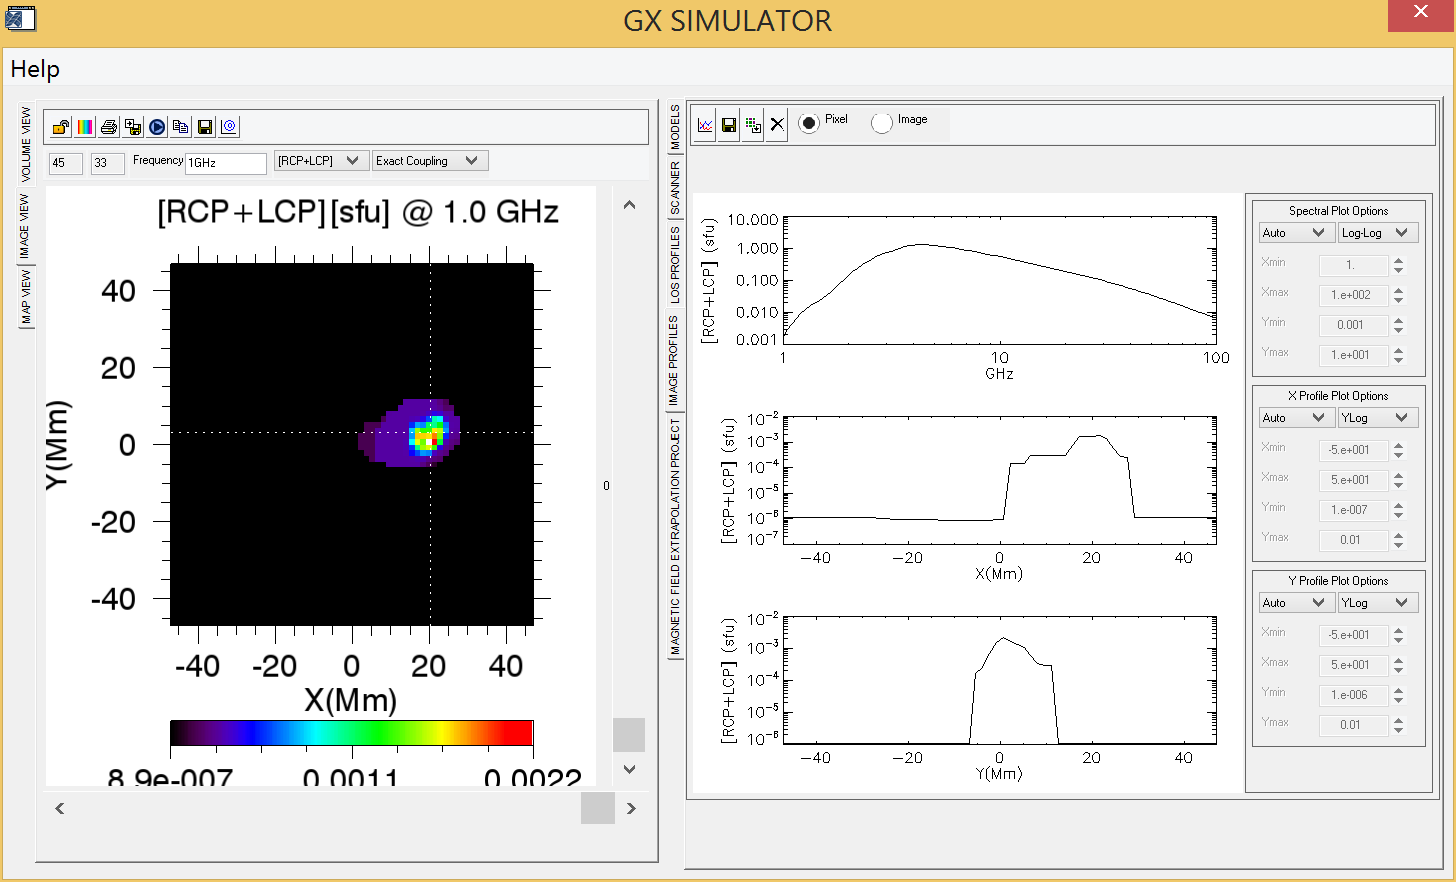
The output image data cube produced by GX_Simulator is displayed on the IMAGE VIEW tab page, where tools are provided to select which of the available data channels to be mapped.
The horizontal slider located at the bottom of the page may be used to saturate the intensity map at a fraction of its maximum value in the map, to allow better contrast for faint features.
The image profiles at a given location of the cursor are displayed on the adjacent IMAGE PROFILES tab page. Based on the option selected by the user, the spectral plot may display either the spatially resolved spectrum corresponding to the cursor position (Pixel), or to the entire integrated image (Image).
The toolbar of the IMAGE VIEW provides the options of
changing the color table,  ,
printing the map,
,
printing the map,  , exporting
the image to a standard image format,
, exporting
the image to a standard image format,  , saving the
image data cube as a multidimensional SSW map structure,
, saving the
image data cube as a multidimensional SSW map structure,  , or save the LOS slices
corresponding to each image row,
, or save the LOS slices
corresponding to each image row,  , in a SSW MULTI_SAVE file format that may be
directly restored using the SSW MULTI_RESTORE function, or
conveniently explored by using the widget interface GX_Explorer
, which is part of the GX_Simulator installation
package.
, in a SSW MULTI_SAVE file format that may be
directly restored using the SSW MULTI_RESTORE function, or
conveniently explored by using the widget interface GX_Explorer
, which is part of the GX_Simulator installation
package.
The image datacube may be also sent to the Plotman display window of the GX_Simulation,  , which offers additional
functionalities.
, which offers additional
functionalities.