10. A sea water sample is to be analyzed for cadmium by flame AA. To avoid matrix effects from the high salt content, the calibration will be done by standard addition. Samples are prepared by pipeting 20.00 ml of sea water into several volumetric flasks and adding 1 ml of nitric acid. After this, measured amounts of a standard containing 0.1 mg/m l cadmium are added to each and the solutions are diluted to the 25.00 ml mark. Each sample is run and the absorbances are as follows.
| Sample number | ml of standard added | Absorbance measured |
1 |
0.00 |
0.31 |
2 |
10.0 |
0.57 |
3 |
20.0 |
0.84 |
4 |
30.0 |
1.11 |
Calculate the concentration of Cd in the sea water.
Since the volume is constant, the additional absorbance is due to the additional analyte added. For sample 2, the amount of added Cd: 10 m l x 0.1 mg/m l = 1 mg
Sample 2 contains original sample + 1 mg. added Cd in 25 ml
absorbance due to added Cd = 0.57 - 0.31 = 0.26
Applying Beer's law, 0.26 = e b (1 mg/25 ml ), so e b = 6.5
The original sample: 0.31 = 6.5 (Cd mg/ml) = 0.048 mg/ml
(It is preferable, of course, to use all the data, so calculate e b from samples 2,3,4 and average these for the e b to use in the calculation )
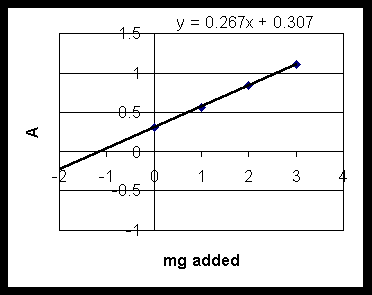
Graphical solution: plot Absorbance(x) vs mg added(y), and do linear regression:

find slope= 0.267, intercept 0.307. So: y = (.0267) x + 0.307
At y = 0 (no Cd added) x = -1.15, so 1.15 mg in 25 ml were in original sample, which is 0.046 mg/ml.
11. Acetone has a molar absorptivity of 2.75 x 10³ L cm-1 mol-1 at 366 nm, in ethanol. What range of concentrations can be measured, so the absorbance remains within the range of 0.08 to 0.3, using a 1.0 cm cell?
from Beer's law:
A = 0.08 = 2.75 x 10³ (1) M
M = 2.9 x 10⁻⁵
A = 0.3 = 2.75 x 10³ (1) M
M = 1.1 x 10⁻⁴
a) 0.4 = e (1) (0.2 x 10⁻⁴) so e = 2.0 x 10⁴
b) 
c) 0.8 = 0.07 L/cm mg (1 cm) C mg/L
C = 11 mg/L
17. A FTIR system was set up to monitor emissions at a factory fenceline. When 20 scans were collected and averaged, the signal to noise ratio for the C-H stretching band was 5/1. How many interferograms should be averaged to obtain a 50/1 signal to noise ratio.
To enhance signal to noise value by a factor of 10 we must increase n by 102.
20 x 100 = 2000 scans