 (
.6)
(
.6)2.4 Statistical Aspects of Sampling
Uncertainty in environmental measurements can come from both the sampling and the analytical measurement. The total variance is the sum of the two factors:
s 2T = s 2s + s 2a ( .1)
where the subscript T stands for total variance; subscripts s and a stand for the sampling and analysis processes respectively. The variance in the sampling process is more difficult to account for. The total variance can be estimated by collecting and analyzing several samples which are expected to produce identical results. The variance of the analytical process can then be subtracted from the total variance to obtain the sampling variance. The variance in the sample not only comes from variation in the sample population, but also from variability during sampling:
s 2s = s 2p + s 2sa ( .2)
where p and sa represent population and sampling procedure respectively. The variation in the population may be due to stratification or to temporal variability.
The most important question is the minimum number of samples needed for meeting the measurement objective. In environmental sampling, the situations vary case by case, and it is not easy to form a sampling strategy based on classical statistical prediction. The discussion here offers a simplified approach to predicting the minimum number of samples required to estimate the average pollutant concentration in a certain population. The total uncertainty, E, at a specific level of confidence, is selected. The value of E, and the confidence limit can be used to estimate the quality of the measurement:
E = z s / n ( .3)
where s is the standard deviation of the measurement, z is the percentile of standard normal distribution depending upon the level of confidence and n is the number of measurements. In environmental measurements, the E, s and n can be assigned to the sources from which the variations arise.
If the variance due to sampling, s s2 , is negligible and the major source of uncertainty is in the analysis, the minimum number of analysis per sample is given by:
na = [z s a/Ea]2 ( .4)
The number of analyses can be reduced by choosing an analytical method which has higher precision, i.e., a lower s a or by using a lower value of z, which means accepting a higher uncertainty.
If the measurement uncertainty is negligible (s a ® 0), the minimum number of samples, ns is given by:
ns = [z s s/Es]2 ( .5)
Again the number of samples can be reduced by accepting a higher uncertainty or by reducing s s. The sample variance can be reduced by using a larger number of samples or by taking composite samples.
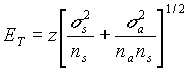
When s a and s s are both significant, the total error ET is given by:
![]() (
.6)
(
.6)
This equation does not have an unique solution. The same value of error, ET, can be obtained by using different combinations of ns and na. Combinations of ns and na should be chosen based on scientific judgment and the cost involved in sampling and analysis. In the usual environmental case, the parameters of the equation are probably not known accurately or even well estimated. Therefore, while statistical equations for determining the number of samples and the number of replicates can be derived, these are seldom of practical use, except as general guidelines.
A simple approach to calculating the number of samples is to collect and analyze a few samples to estimate an overall standard deviation, s. Using Students-t distribution, the number of samples required to achieve a given confidence level is calculated as:
n = (ts/e)2 ( .7)
where t is the t-statistic value selected for a given confidence level, and e is the acceptable level of error or uncertainty. The degrees of freedom which determine t can be first chosen arbitrarily and then modified by successive iterations. If an experimental value of s s is not available, an estimate may be done from previous similar studies.
Example:
Preliminary analysis of a few samples from a contaminated site showed Cr(VI) concentrations between 5 to 20 m g/g, and a standard deviation of 3.25. Calculate the number of samples required so that the sample mean would be within ± 1.5 m g/g of the population mean at the 95% confidence level. Let us assume 10 degrees of freedom. Using equation 2.7 and the t-table:
t = 2.23, s = 3.25, and e = 1.5
n = (2.23*3.25/1.5)2 = 23 Since 23 is significantly larger than 10, an iteration must be done with a new value of t corresponding to 23 degrees of freedom:
n = (2.069*3.25/1.5)2 = 20
Therefore, 20 samples should be tested. To reduce the number of samples a higher level of error or a lower confidence level may be accepted.
a) To study the contamination of fish in a river where a chemical company has a waste water discharge outlet.
b) To identify accident release of chemicals by the industry mentioned above.
c) To implement strategies to reduce smog formation in your city.
d) To study the effect of auto exhaust on the air quality in your city.
e) To identify ground water contamination around an abandoned chemical factory.
f) To determine if apples from a sprayed orchard are contaminated with pesticides.