Contents
MATLAB tutorial: how to plot a function of one variable
Math 331, Fall 2016 * Vitor Matveev * Lecture 1
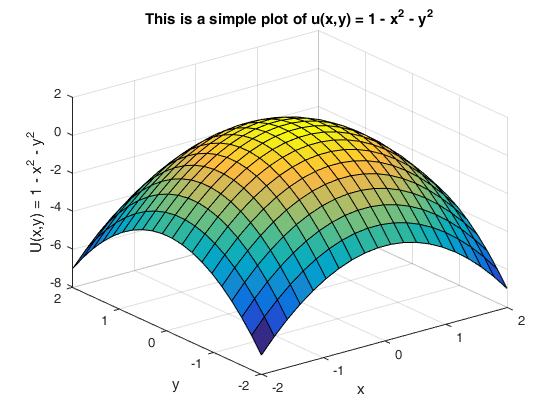
We will make a simple plot of the following paraboloid (for x in [-2, 2])
u(x,y) = 1 - x^2 - y^2
Note that just a couple lines accomplish this task:
L = 2;                    % Define the size of coordinate box
x = linspace(-L, L, 20);  % Create an array of "x" coordinates in [-L, L]
y = linspace(-L, L, 20);  % Create an array of "y" coordinates in [-L, L]

[X, Y] = meshgrid(x, y);  % Make an [X, Y] grid (mesh) using (x, y) above
U = 1 - X.^2 - Y.^2;      % IMPORTANT: note the periods "." in operations
surf(X, Y, U);            % surf plots the surface

xlabel('x'); ylabel('y'); zlabel('U(x,y) = 1 - x^2 - y^2');
title('This is a simple plot of u(x,y) = 1 - x^2 - y^2');

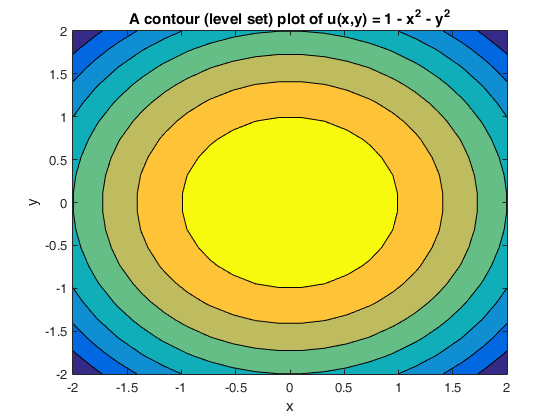
Alternative method of visualization: level curves / contour plot
hold off;
contourf(X, Y, U);     % Filled Contour plot of same function
xlabel('x'); ylabel('y'); zlabel('U(x,y) = 1 - x^2 - y^2');
title('A contour (level set) plot of u(x,y) = 1 - x^2 - y^2');
