Error estimates are an integral part of any measured physical quantities, and need to be suitably made and reported in figures, tables and text. In the next section on Error Analysis, standard methods are described for determining errors on measured quantities or the combination of measured quantities. Here we mention general stylistic guidelines for proper reporting of errors.
First, absolute errors carry the same units as the affected physical
quantity. For example, a measured distance of L = 3.7 m can have
an uncertainty of ![]() =
= ![]() 0.2 m (not just
0.2 m (not just ![]() 0.2). Errors are sometimes reported as fractional errors
0.2). Errors are sometimes reported as fractional errors ![]() usually stated in % (this time with no units). For example, here we could
say that the measured distance L is 3.7 m, known to 5% accuracy
(0.2/ 3.7). The best way to report the measurement is L = (3.7
usually stated in % (this time with no units). For example, here we could
say that the measured distance L is 3.7 m, known to 5% accuracy
(0.2/ 3.7). The best way to report the measurement is L = (3.7 ![]() 0.2) m. Note that the number of decimal places on the quantity and the
error match; it would be wrong to quote (4
0.2) m. Note that the number of decimal places on the quantity and the
error match; it would be wrong to quote (4 ![]() 0.2) m or (3.7
0.2) m or (3.7 ![]() 0.23) m .
0.23) m .
Errors should be stated with at most two significant figures. Any extra
digits are completely meaningless. For example, a magnetic field is derived
from a current in a coil, and found to have strength B = 0.456T,
and a calculation of the error on B from the known error on the
current yields ![]() =
= ![]() 0.03654T . Then you can report B = (0.456
0.03654T . Then you can report B = (0.456 ![]() 0.037) T or B = (0.46
0.037) T or B = (0.46 ![]() 0.04) T . Quoting any more significant figures would be wrong.
0.04) T . Quoting any more significant figures would be wrong.
When dealing with very large or very small numbers, one should use exponential
notations. In such cases, errors should be reported with the same power
of 10 as the physical quantity. For example, the speed of light in an experiment
is measured to be c = 3.00765 ![]() 10^8 m/s with a calculated error
10^8 m/s with a calculated error ![]() =
= ![]() 4.076
4.076 ![]() 10^6 m/s . Then the final result should be reported as
10^6 m/s . Then the final result should be reported as
c = (3.008 ![]() 0.041)
0.041) ![]() 10^8 m/s.
10^8 m/s.
Measurements presented in a plot need to always be accompanied by the proper error bars.
Measurements reported in a table need to always be accompanied by the proper errors and units, although errors and units can be specified in the column header if they are the same for the entire column. An example is shown in Table 1.
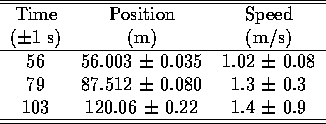
Table 1. An example of reporting errors.
There are two main types of experimental errors in physical measurements. Systematic Error will cause the distribution of data points to be offset with respect to the true value. Causes of systematic error may be poor measurement technique, errors in instrumental calibration, software errors or failure to correct for external conditions (e.g. temperature). Possible sources of systematic error must be considered in all of the stages of the experiment, from design to the data analysis.
Random Error is the error from the true value which occurs in any physical measurement. The assumption is that this error will result in experimental readings which are equally distributed between too high and too low, and the mean value reflects the true value, to within some precision. Such a distribution of data can be represented by a Gaussian distribution. It must be kept in mind that certain types of measurements do not result in Gaussian distributions of data points. For instance, repeated measurements of the number of radioactive decays in a time interval will result in a Poisson distribution due to the fact that the number of decays will never be less than 0. We will return to this below. In many cases the Poisson distribution and others may be approximated by a Gaussian, and the following error analysis may be applied.
Analysis of Random Error
Gaussian Statistics (the most common error distribution)
Standard Error is the error in a single measurement. It is the precision
to which one can measure an experimental quantity in one reading, and is
denoted by ![]()
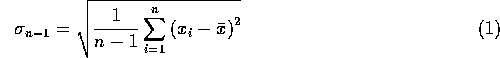
with
![]()
where ![]() is a particular reading,
is a particular reading, ![]() is the mean reading, and n is the number of readings. Most calculators
have a standard error function, and use of this can save time when dealing
with multiple measurements.
is the mean reading, and n is the number of readings. Most calculators
have a standard error function, and use of this can save time when dealing
with multiple measurements.
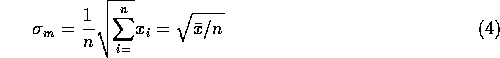
When quoting the final result, the appropriate error to quote is the
Standard Error in the Mean, which reflects the increased precision resulting
from making multiple measurements. This is denoted by ![]()
![]()
Poisson Statistics
When dealing with counting (or Poisson) statistics, i.e. when the quantity measured is a number of counts (e.g., of radioactive decays), the appropriate formula for the error in the mean is:
If the general formula is used instead of this one, the error in the mean obtained will be overestimated.
Since most physical measurements do not directly result in the quantity of interest, it is necessary to propagate the error of measurement to the final quantity of interest. The following results are based on a formal statistical theory of random errors and have been reduced down to a few simple equations.
Addition or Subtraction
![]()
Functions

Functions of more variables are dealt with in the same way, i.e. there are additional terms in the square root. Some of the simple relationships which can be derived from the above equation are:
Multiplication or Division

Powers
![]()
Correlated Errors
When carrying out the error analysis it is extremely important that correlated errors be dealt with properly. In keeping with the assumption of random errors, all variables used in the error equations must be independent variables. Otherwise, serious mistakes can occur in evaluating the error.
As a trivial example, consider the error in the calculation of the volume
of a cube from one measurement of the length of one side: ![]()
If these variables (which have resulted from one measurement and are identical) are treated as independent variables, the following result is obtained using the multiplication rule above:

This, however, is incorrect. Since the errors are not independent (all of them are the same), the correct procedure is to write the equation in terms of one variable and to carry out the propagation on that, as a formula with one independent variable:
![]()
truecm
The criterion for consistency is used to determine if two measured values of a parameter are consistent with one another. It arises from statistical theory and must be regarded as a loose inequality. It is meant to provide a guide to the validity of experimental or theoretical results.
If two different determinations of a parameter are made, ![]() and
and ![]() then they are consistent if
then they are consistent if ![]()
Take a set of n pairs of measurements ![]() and
and ![]() where
where ![]() are possible systematic errors on the
are possible systematic errors on the ![]() and
and ![]() are the statistical (random) errors on the
are the statistical (random) errors on the ![]() (from the probability distribution of y at the particular
(from the probability distribution of y at the particular ![]() of interest). Define
of interest). Define ![]() (in practice this often simplifies to
(in practice this often simplifies to ![]() when the statistical errors dominate). If a linear relationship of the
form y= a+bx is suspected between the two variables,
the linear least squares fit parameters a and b can be obtained
from the following formulas:
when the statistical errors dominate). If a linear relationship of the
form y= a+bx is suspected between the two variables,
the linear least squares fit parameters a and b can be obtained
from the following formulas:
![]()
![]()


where

In the case where all data points have the same error ![]() these formulas simplify to:
these formulas simplify to:
![]()
![]()

![]()
where