Magnetic reconnection, a fundamental process in astrophysical environments plasma is believed to facilitate the release of energy stored in the magnetic field. However, where the magnetic reconnections occur, how and where the released magnetic energy is transported, and how it is converted to other forms remain unclear.
Here, we report well-connected observational signatures of magnetic reconnection, plasma heating, and electron acceleration observed during the post-impulsive gradual phase of the X8.2-class eruptive solar flare on 2017 September 10 (see a collection of relevant papers of the celebrated limb flare on ADS). The combined white light and EUV imaging observations allow us to identify the timing and location of multiple intermittent reconnection events by tracking bi-directional plasma outflows in an extremely long plasma sheet. The arrivals of the plasma downflows at the looptop region of the flare arcade correlate with plasma heating events that manifest as impulsive X-ray bursts. In the meantime, nonthermal microwave bursts, obtained by Expanded Owens Valley Solar Array (EOVSA; Gary et al. 2018), are detected in the loopleg region, which have no response in hard X-rays. Such a chain of reconnection-associated observational signatures offers a new view of the energy release and conversion processes with a level of clarity not previously achieved.
Impulsive Microwave/X-Ray Bursts in the Post-impulsive Phase

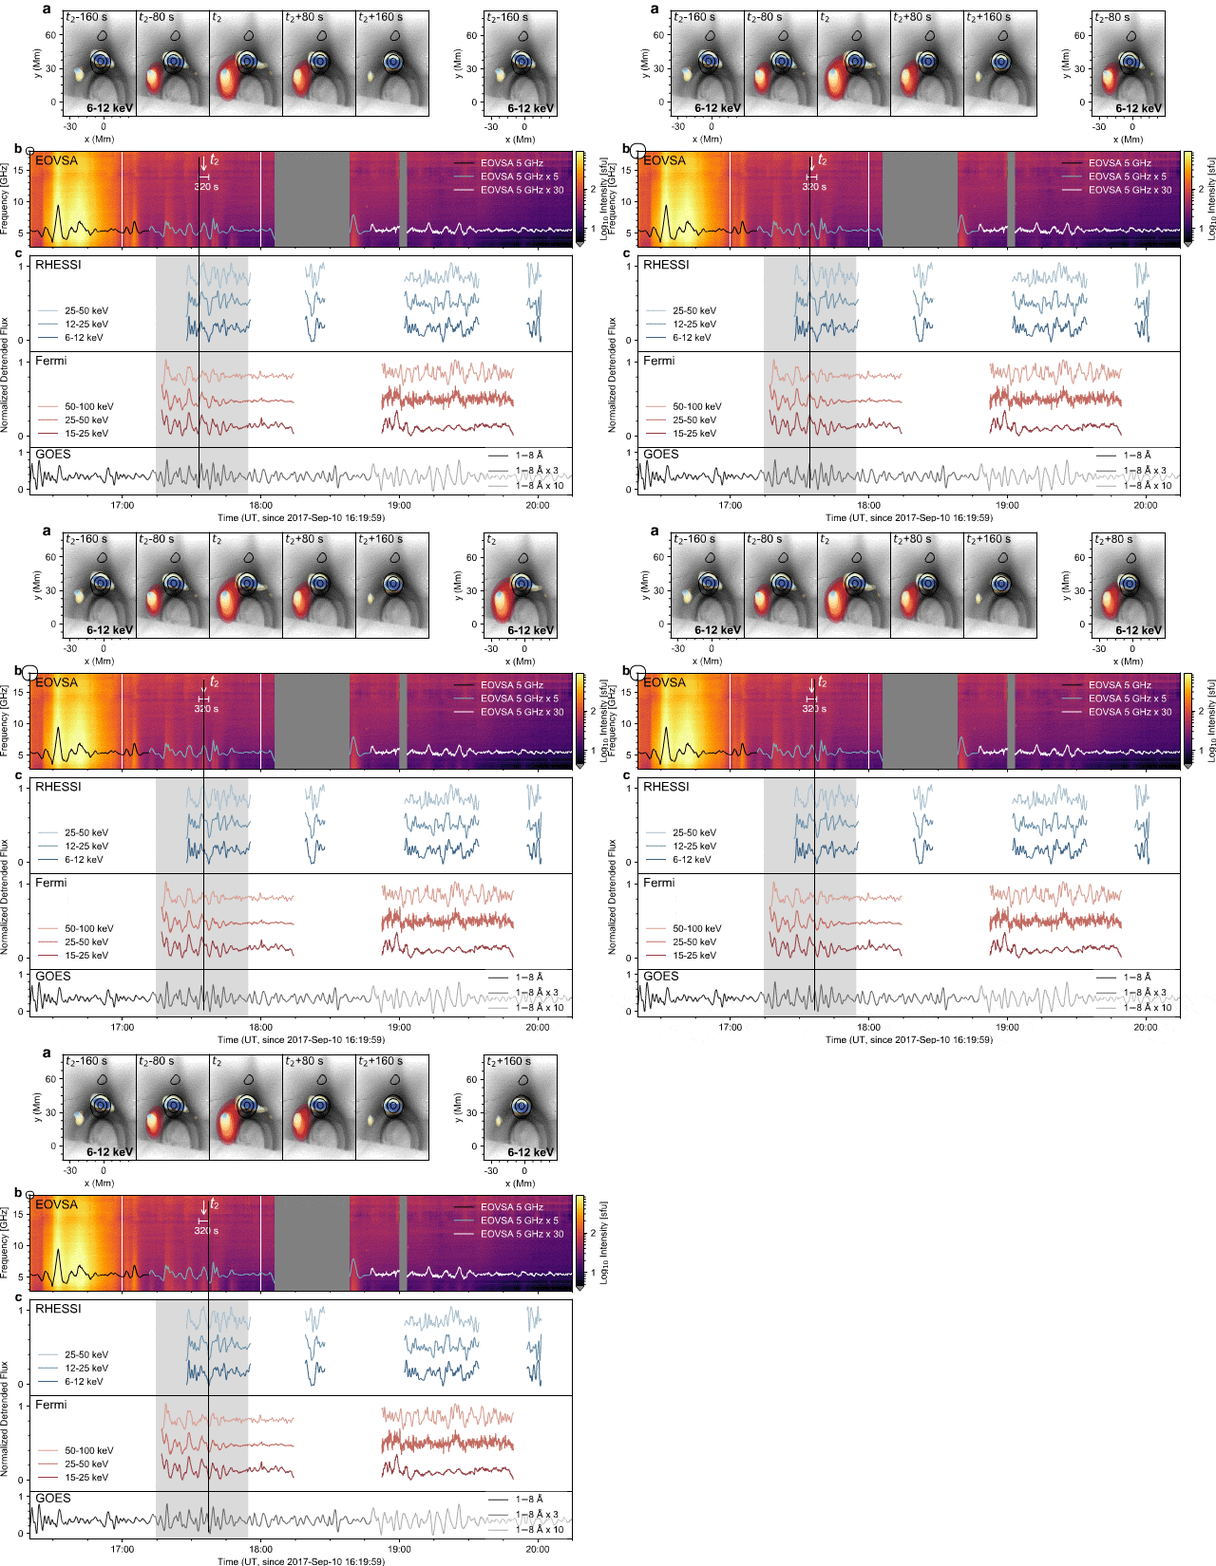
During the post-impulsive phase of the flare, the EOVSA total-power (full-disk integrated) microwave dynamic spectrum is featured by multiple broadband bursts (Figure 1(b)). These bursts have an impulsive appearance in the dynamic spectrum and light curves. These bursts have an average recurrence period of ∼5.6 minutes. The individual microwave bursts correlate with weak X-ray bursts at 6–100 keV observed by both RHESSI and Fermi/GBM (Figure 1(c)).
EOVSA multi-frequency images (Figure 1(a)) show that the overall morphology of the evolving microwave source is consistent with the shape and orientation of the EUV flare arcade. There appear to be two distinct sources: one coincides with the looptop HXR source, while the other is in the northern leg of the flare arcade (right side of the diagram). We note that microwave emission is weak or absent in the southern leg of the flare arcade (right side in the diagram).
The time-series of microwave images reveals that the impulsive component of the microwave emission in each burst is mainly from the loopleg source. In these time-sequence images, the loopleg source shows a large variation in intensity during each burst. In contrast, the looptop source appears relatively stable with more-minor variations in morphology and intensity.
Reconnnections in the late phase: bidirectional outflows vs. Microwave/X-Ray Bursts

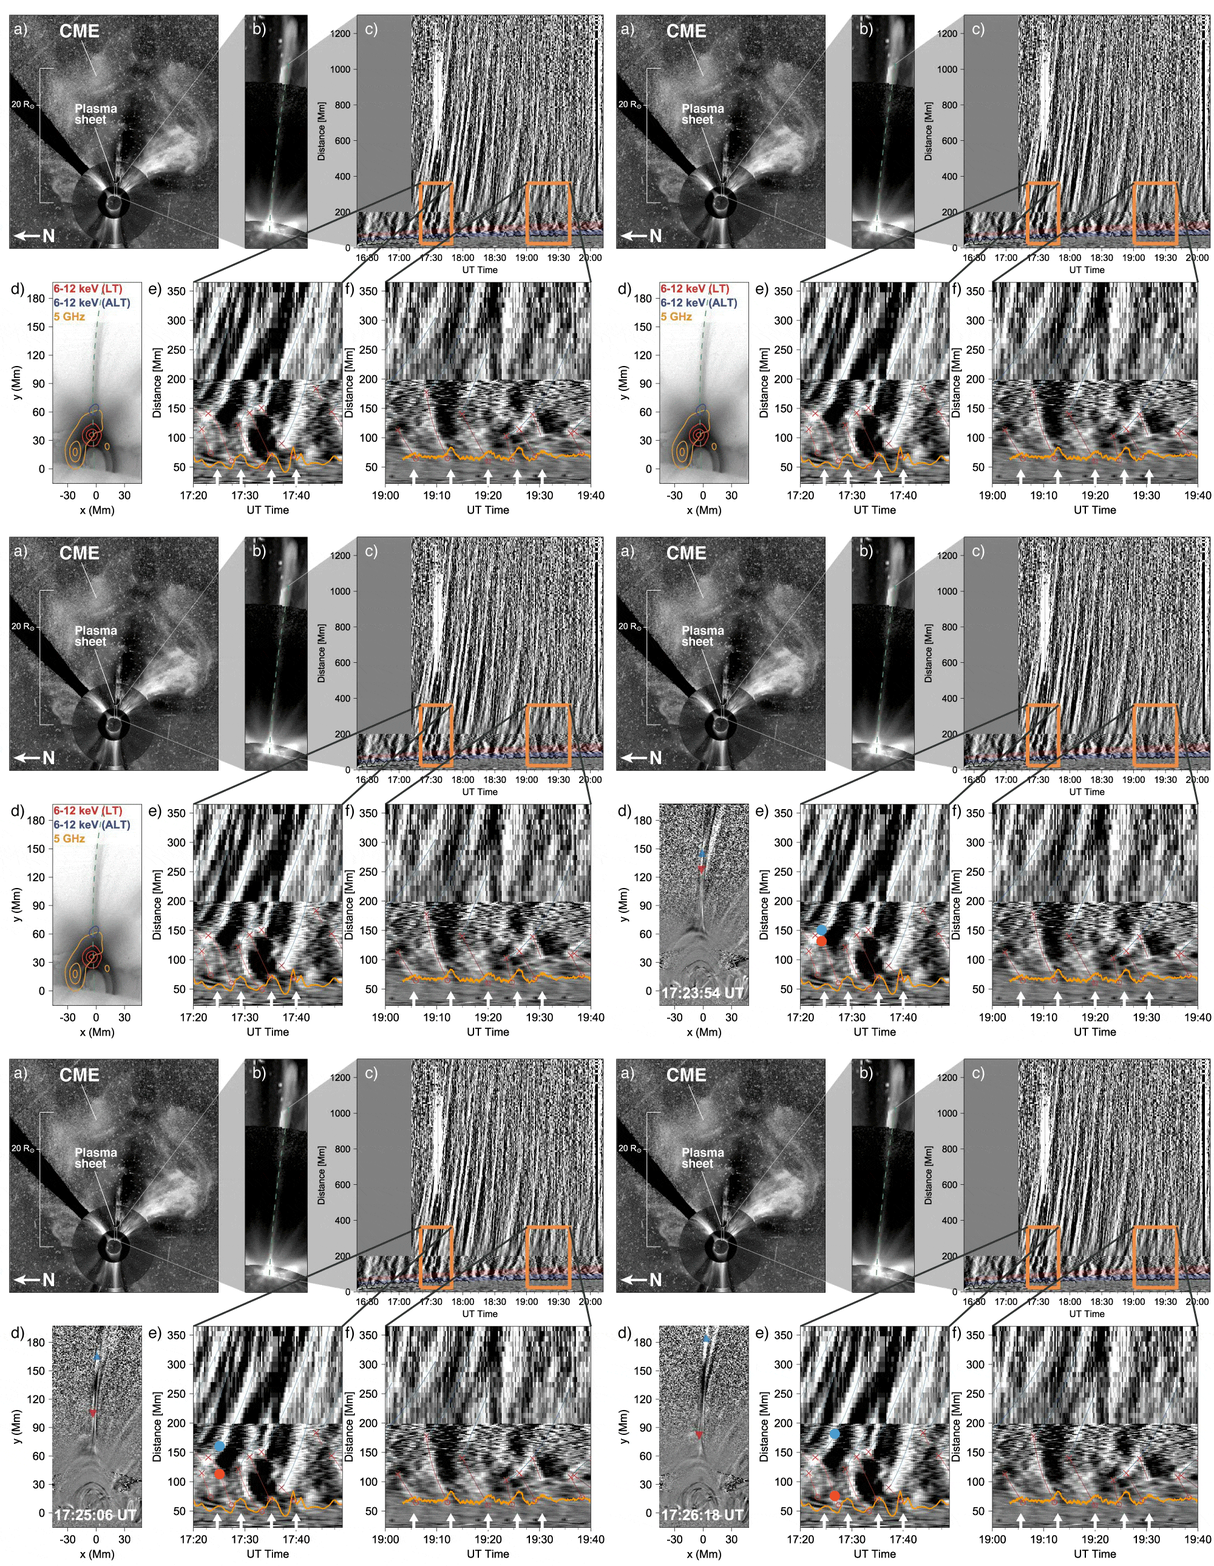
Shortly after the eruption of the coronal mass ejection, a large-scale reconnection current sheet (RCS; see our other recent paper Chen et al. 2020 and references therein) appeared in white and EUV images (Fig 2(a)-(b)). Multitudes of plasma outflows are present in the RCS during different phases of the event for an extended period of time. We find many recurring pairs of bi-directional plasma outflows that propagate simultaneously along the RCS (Figure 2(d)). The upward-moving EUV outflows extend well into the MLSO/K-cor field of view in white light to at least 1100 Mm (or 1.6 R⊙) above the solar surface (red shaded region in Figure 2(c)). The downward-moving EUV outflows seem to terminate at the looptop region (blue shaded region in Figure 2(c)). Each pair of bi-directional outflows appears to diverge from a discrete site at varying heights in the plasma sheet. We attribute the diverging location of each bi-directional outflow pair as the site of an individual magnetic reconnection event (or reconnection “X” point). Most of these identified reconnection sites are located at d ≈ 50–180 Mm above the limb (Figure 2(c)), which is only 1%–3% of the total length of the plasma sheet (~10 R⊙) during that period.
The downflows fade away as they merge into the tip of the cusp-shaped flare arcade, where a multitude of slow, downward-contracting loops are present. We illustrate the timing of the impulsive microwave bursts in accordance with the observed EUV plasma downflows in Figure 2(e,f). We overlay the EOVSA 5 GHz microwave light curve (from Figure 1(b)) on the time–distance plots near the separatrix region where the downflow motions appear to “terminate”. The arrival of most EUV plasma downflows at the separatrix region is immediately followed by a microwave burst. This correlation in both space and time is a strong indication for a causal connection between the plasma downflows arriving at the looptop and the appearance of microwave-emitting nonthermal electrons in the flare arcade.
Discussion and Conclusion

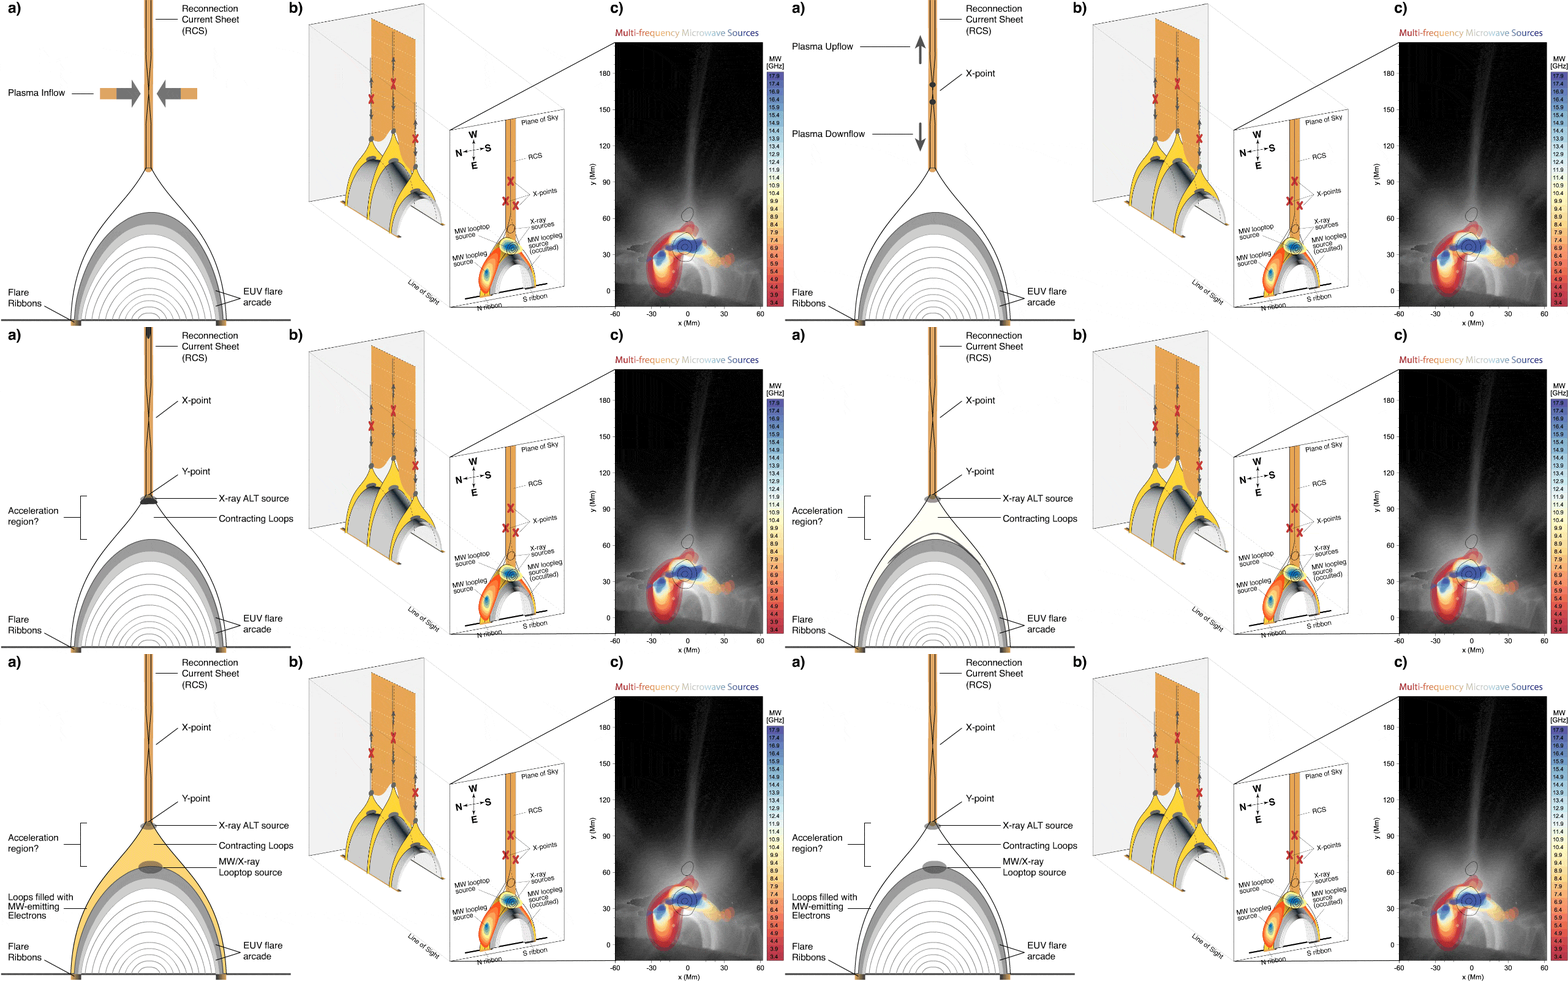
Our observational results are consistent with the standard eruptive flare scenario for the post-impulsive phase (Benz 2017). A schematic picture is shown in Figure 3. Sporadic magnetic reconnections occur at localized magnetic null points (or X points) in the RCS, creating pairs of highly bent magnetic flux tubes. Plasma is ejected from the X points both upward and downward along the RCS, resulting in bidirectional plasma outflows.
The plasma outflows carry a significant portion of the total released magnetic energy in the form of electromagnetic Poynting flux, enthalpy flux, and kinetic energy flux of the bulk flows and turbulence (Fletcher & Hudson 2008). Arrival of the downward-propagating plasma outflows at the cusp region dissipates their energy, resulting in plasma heating through thermal conduction and/or adiabatic heating. If a fast-mode termination shock is established in the cusp region (which is perhaps implicated by the presence of the secondary ALT X-ray source near the cusp tip), plasma heating would occur in the shock downstream region (Forbes 1986; Masuda et al. 1994). Such heated plasma is revealed by the thermal X-ray and microwave source observed at the loop top.
The cusp region may serve as the primary plasma heating and electron acceleration site. This argument is supported by the relative timing between the X-ray/microwave bursts and the magnetic reconnection events in the RCS—the occurrence of the X-ray/microwave bursts correlates with the arrival time of the plasma downflows at the cusp, but not the time of the magnetic reconnection events themselves. A straightforward interpretation is that the electrons responsible for the microwave bursts are accelerated locally at the looptop, where freshly injected energy is available from the arrival of the plasma downflows.
About this post
Based on the recent paper: Sijie Yu, Bin Chen, Katharine K. Reeves, Dale E. Gary, Sophie Musset, Gregory D. Fleishman, Gelu M. Nita, and Lindsay Glesener (2020) "Magnetic Reconnection during the Post-impulsive Phase of a Long-duration Solar Flare: Bidirectional Outflows as a Cause of Microwave and X-Ray Bursts", 2020, The Astrophysical Journal, 900, 17. DOI: https://doi.org/10.3847/1538-4357/aba8a6; Preprint: https://arxiv.org/abs/2007.10443
Reference
Chen, B., Shen, C., Gary, D. et al. 2020, Nat. Astron, 10.1038/s41550-020-1147-7
Benz, A. O. 2017, LRSP, 14, 2
Fletcher, L., & Hudson, H. S. 2008, ApJ, 675, 1645
Forbes, T. G. 1986, ApJ, 305, 553
Forbes, T. G., & Acton, L. W. 1996, ApJ, 459, 330
Gary, D., Chen, B., Dennis, B., et al. ApJ, 863, 83
Masuda, S., Kosugi, T., Hara, H., et al. 1994, Natur, 371, 495