In addition to the
structure of the non-flaring Sun, radio emission is exquisitely sensitive
to flaring emission. Let us define such emission to be any brightening
with time variability on scales shorter than a few hours. Of course,
the Sun is continuously variable on all timescales, so this division is
somewhat arbitrary, but it will suffice for our purposes. The brightening
can take on a fantastic range of forms, from a slight increase due to heating
(thermal emission) to 1000-fold increases in seconds or less. We
have already discussed the radio emission mechanisms that are important
-- free-free emission (bremsstrahlung), gyrosynchrotron emission, and plasma
emission. Gyroresonance emission could also be produced due to heating,
of course.
All of solar activity arises
due to the solar magnetic field. There is a famous saying, attributed
to various people, that "If it did not have a magnetic field, the Sun
would be as uninteresting an object as most astronomers believe it to be."
But fortunately for us, it does have a magnetic field, and so produces
a wonderful variety of phenomena that are interesting to study -- and that
are also important -- since solar activity affects us directly in many
ways here on Earth.
The solar
flare starts with a period of energy storage, called flare
build-up, that can occur over a period of days, but often
results from the eruption of new magnetic flux from below the photosphere,
which can take only hours. The stored energy takes the form of a
non-potential magnetic field distribution. During this time, the
changes take place in conditions of ideal MHD
(ideal Magnetohydrodynamics), meaning that there is a balance of magnetic
and gas pressures, and the field lines are "frozen in." Once conditions
in the corona are right, the magnetic field can release its energy, sometimes
in seconds, through a mysterious process called magnetic
reconnection. In this process, the field lines are
cut (something normally impossible in ideal MHD) and reconnected to a lower-energy
configuration that is closer to potential. The difference in energy
between the original non-potential configuration and the resulting, more
potential configuration is available for mass motions, acceleration of
charged particles, and generation of waves.
What we call the flare can
represent the immediate release of energy, the initial heating and acceleration
of the charged particles, and all phenomena associated with the resulting
mass motions and subsequent thermalization of the particles. One
associated phenomenon is the Coronal
Mass Ejection (CME), which is a magnetic bubble that becomes unstable
and buoyant, leaving the Sun and propagating out into interplanetary space.
There is a lot of argument about the relationships between flares and CMEs.
The old assumption was that CMEs were the result of the flare, but timing
studies are ambiguous and there is at least as much evidence that CMEs
cause flares! In fact, both flares and CMEs can occur one without
the other, so it is perhaps best to consider them related but separate
phenomena.
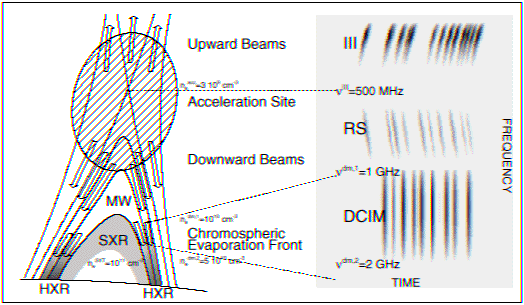
Figure 1: A schematic view of a solar flare
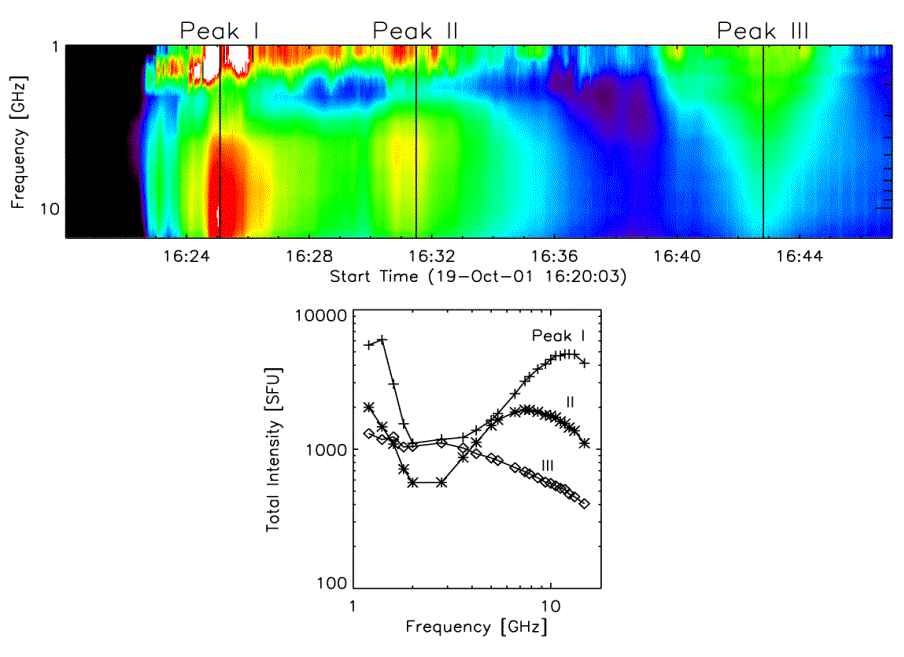
At still higher frequencies,
electrons trapped on closed loops (the loops labeled MW) cause the gyrosynchrotron
emission. Here is a radio dynamic spectrum from OVSA, showing
the > 1 GHz part of this emission:
At still lower frequencies,
the metric burst types are seen. These types were discovered in the
1950's, through the use of spectrographs, and each type has a unique signature
in frequency and time. Here is a schematic diagram.
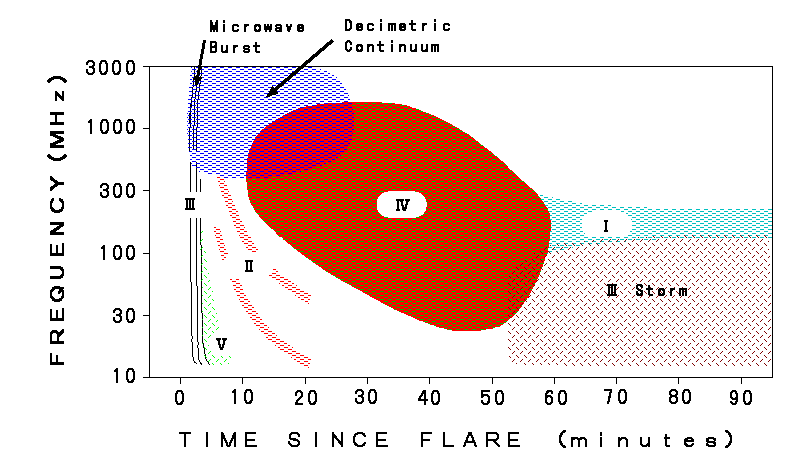 The types are:
-
Type I
-
type
I bursts or chains, narrowband, non-drifting bursts of short
duration
-
cause is unknown, but emission
appears to be plasma emission
-
type
I storm -- a continuum emission with many type I bursts
embedded, duration days
-
cause is unknown, but related
to continuous reconnection above active region
-
Type II
-
type
II burst, slowly drifting, often with fundamental/2nd harmonic
structure, due to plasma emission
-
cause is a shock wave, propagating
at 500-2000 km/s outward into the corona into interplanetary space (also
seen down to kilometric wavelengths).
-
Type III
-
type
III burst, rapidly drifting, often with fundamental/2nd
harmonic structure, due to plasma emission. The fundamental is highly
o-mode polarized, and the 2nd harmonic is weakly (15%) x-mode polarized.
-
cause is a stream, or beam,
of electrons moving at speed ~ c/3,
propagating from low corona into interplanetary space (also
seen down to kilometric wavelengths).
-
type
III storm -- a long lasting (up to a day or more) series
of type III bursts, RS (reverse slope) bursts, reverse-drift pairs, and
continuum.
-
Type IV
-
stationary
type IV -- broadband continuum emission, sometimes highly
polarized, due to either plasma emission (o-mode polarized) or gyrosynchrotron
emission (x-mode polarized).
-
cause is a plasmoid or high,
filled loops of non-thermal particles
-
moving
type IV -- a similar cause, but entrained in a CME or expanding
arch.
-
Type V
-
type
V burst, continuum emission following a type III burst,
x-mode polarized (opposite sense to the associated type III)
-
cause is slower type III-like
electrons in widely diverging magnetic fields, with both forward and counterstreaming
langmuir waves, perhaps generated by previous passage of type III electrons.
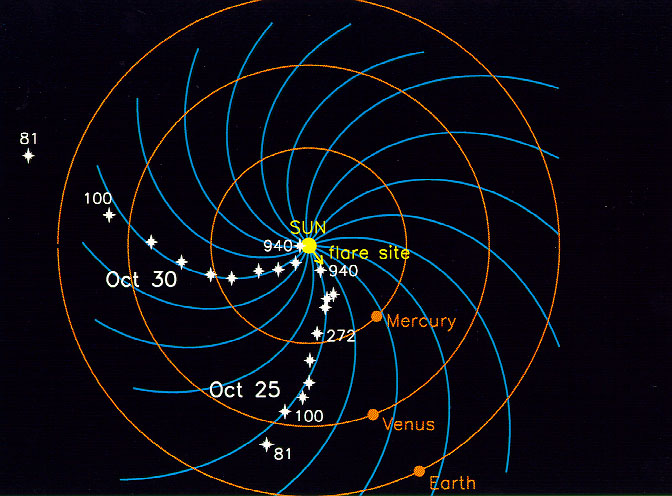
One can observe type III bursts
propagating all the way to Earth and beyond, as we saw in the earlier homework
problem. By using a spacecraft equipped with a rotating dipole, the
direction of the emission can be determined, and its frequency (proportional
to square root of density) gives its distance from the Sun (using a density
vs. distance model). Here is an example of tracing two type III bursts
from the Sun out into the IP medium. You can see how the electrons
trace the archimedian spiral (Parker spiral).
There are several
useful diagnostics that can be deduced from gyrosynchrotron emission.
As we discussed in Lecture 3, the emission
is broadband emission, with optically thick emission at low frequencies
(typically 2-5 GHz), optically thin emission at high frequencies (>10 GHz),
and a peak around 5-10 GHz. The peak frequency is related to the
magnetic field strength and number density, the optically thin spectral
index is related to the electron powerlaw index, and the polarization tells
us about the direction of the magnetic field. The sensitivity of
microwave emission to these parameters makes it a useful complement to
other measures of the accelerated electrons, i.e. hard X-rays.
Acceleration, Trapping,
and Precipitation
Before showing some examples,
it is useful to examine what happens to charged particles after they have
been accelerated. The goal is to understand the acceleration itself,
which is fundamental to magnetic reconnection. At present it is largely
a mystery how the reconnection process can accelerate so many particles
in such a large volume in seconds. Let us leave the acceleration
as a "black box," and see what can happen to the particles afterward.
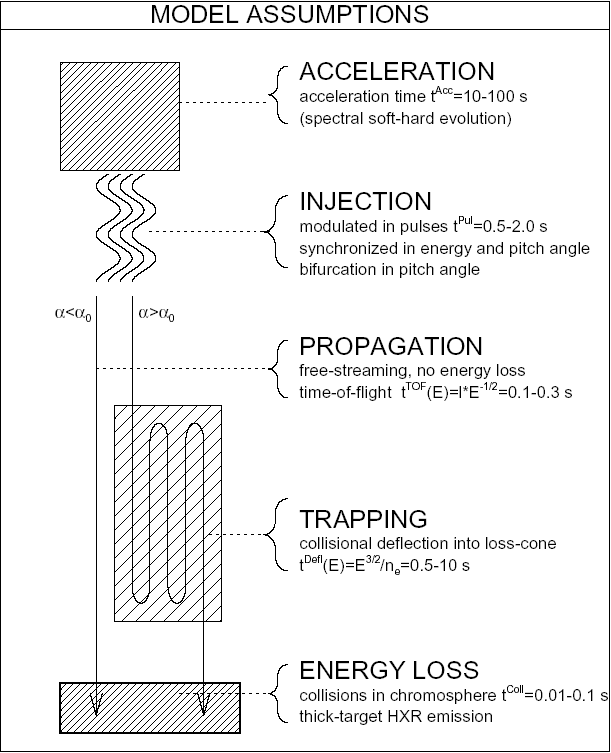
From Aschwanden (1998)
The acceleration is connected
to the emitting volume through a process called injection.
This allows the emitting volume to be separate from the acceleration volume.
In addition, the injection into the volume can be modulated separately
from the acceleration. After injection the electrons can go directly
to the chromosphere (if they are in the loss-cone) and be lost, generating
hard X-rays, or they can go into a magnetic trap for awhile, before ultimately
escaping and suffering the same fate. The trapped electrons are the
ones that produce the bulk of the microwave emission. A cartoon of
the geometry is:
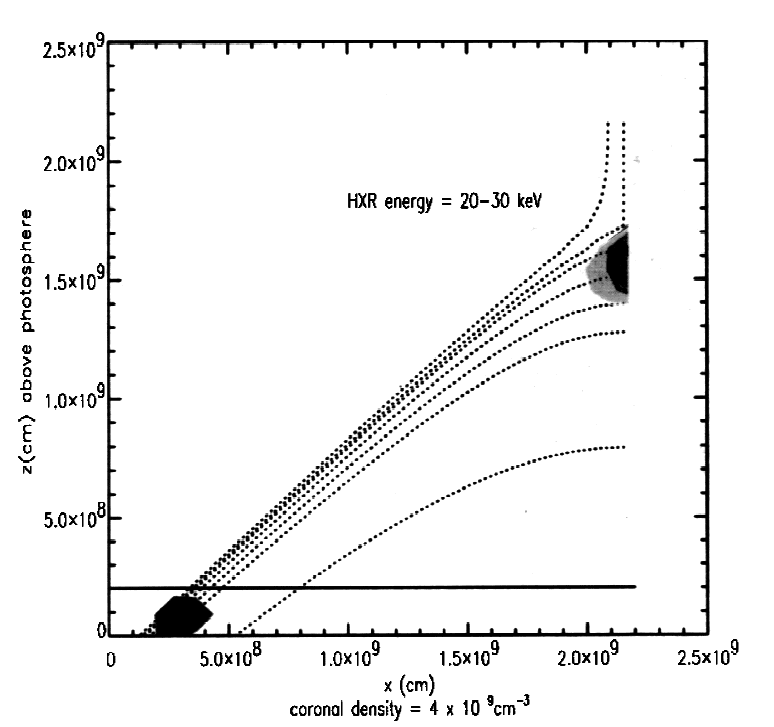
From Fletcher and Martens (1998)
Each of the above processes
affects the time profile and energy distribution of the electrons, and
those electrons ultimately produce the radio emission.
-
The acceleration
itself will have a time profile that can be arbitrary, somehow associated
with the reconnection rate.
-
The injection
process
-
can be trivial, just a delta
function that transmits the particles with the same time and energy characteristics
as the acceleration,
-
or it can modulate the acceleration
in both time and energy (including pitch angle).
-
As shown on the left in the
figure, the propagation can
also be trivial, simply transmitting the electrons to the chromosphere
with only a short delay. Typically some fraction of the electrons
(those in the loss cone, with pitch angle α
< αo)
will escape in this way. The loss cone is a function of the ratio
of the magnetic field Binj
at the injection point (often considered the loop top) and the magnetic
field at the Bloss
loss point (the footpoint): Bloss /
Binj = 1/sin2αo.
-
If both injection and propagation
are trivial, then the hard X-rays produced in the chromosphere (energy
loss) will mirror exactly the time and energy characteristics
of the acceleration. This makes hard X-rays a particularly useful
diagnostic of the acceleration process. This component of hard X-ray
emission is called the direct precipitation
component.
However, we have no reason to
believe that the injection and propagation are trivial. We often
see pulsations or modulations of the acceleration that can be attributed
to the injection process. The propagation itself will be subject
to other effects such as
-
trapping:
Typically some fraction of the electrons (those not in the loss cone, with
α
> αo)
will be trapped for a time. Trapping results in an integration, where
the product of acceleration and injection time profiles are convolved with
an exponential decay time (the loss time).
-
escape
from the trap: This is due to particles being scattered into the loss cone.
Such escaping particles will also produce hard X-ray emission when they
strike the chromosphere, and this is called the secondary
precipitation component. This can happen due to
-
Coulomb collisions (collisions
between ions and electrons), in which case the collisions are energy dependent
(larger effect on low-energy particles), which will flatten, or harden
the electron energy spectrum over time. In this case if the original
powerlaw spectral index is δ,
the new spectral index after collisions will be δ − 3/2.
-
Wave-particle interactions,
in which case the energy dependence is more complicated, depending on the
wave modes involved, and the electron energy spectrum will in general not
be a diagnostic of the accelerated spectrum (unless the wave mode interaction
is understood in detail, theoretically).
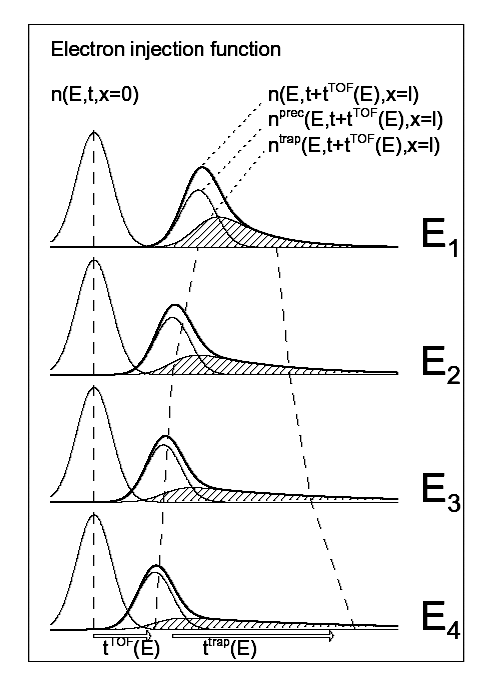
The temporal relationships among
injection, the direct precipitation, and the secondary precipition are
shown in the following figure.
From Aschwanden (1998)
You can see that there are
two opposite energy dependences. The TOF, or time-of-flight, delay
decreases with increasing energy (they are simply moving faster) while
the trapping time increases with increasing energy (because the higher
energy particles suffer less from Coulomb collisions, and so do not scatter
into the loss-cone so quickly.
Microwave Observations
It is within this framework
that we now try to understand microwave emission from flares. The
shaded component in the figure above is the hard X-ray signature from the
slowly escaping electrons, but at the same time the trapped population
(the ones that have not yet escaped) can be huge and it is that population
that is producing the microwaves. Note that electrons much more readily
produce microwave emission (which requires only small accelerations) than
they do hard X-rays (which require large accelerations, essentially stopping
the electrons). This means that microwaves are far more sensitive
to high-energy electrons than are hard X-rays.
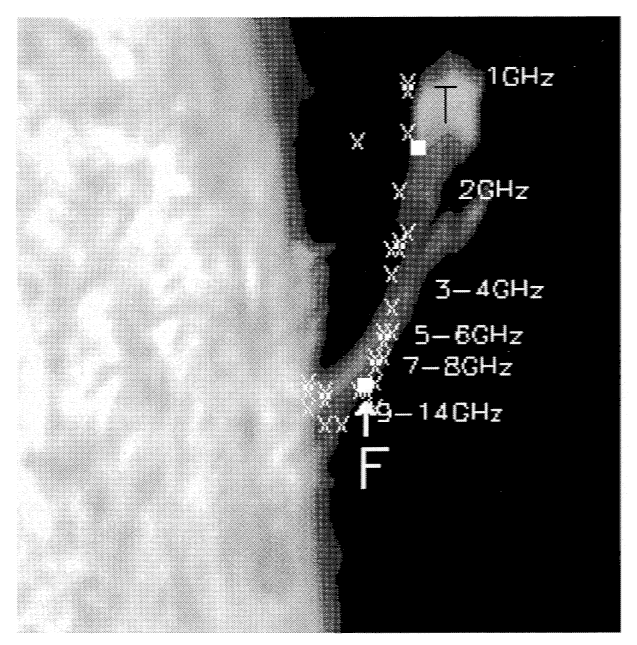
The frequency of the microwaves
is proportional to the magnetic field, so when we make images at many frequencies
we see a dispersion in position, essentially mapping out the magnetic field.
From Wang, Gary, Lim & Schwartz (1994)
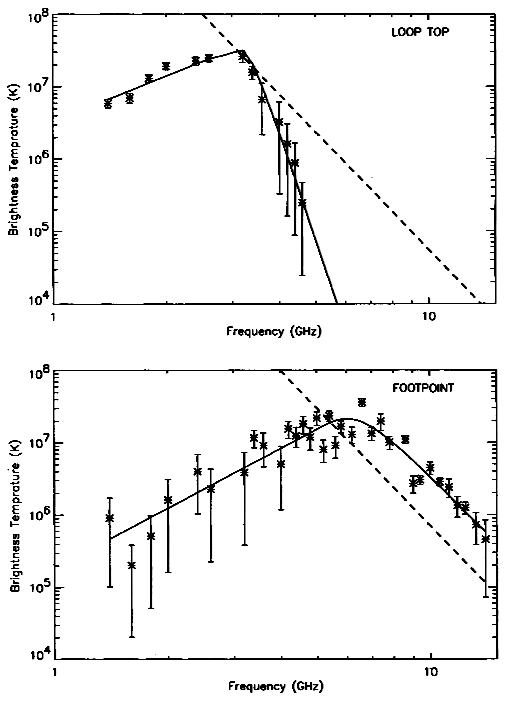
When we make spatially resolved
brightness temperature spectra at different points along the loop, we see
that different parts of the loop look quite different. Again, the
peak frequency is related to the magnetic field strength. The upper
spectrum is taken at the location marked T, for "top", in the photo, while
the lower spectrum is taken at the point marked F, for "footpoint".
The H-alpha image shows a surge that occurred later than the flare, but
we take the surge as marking the location of a large loop that was involved
in the earlier flare. The footpoint may actually be the location
of a separate, smaller flaring loop.
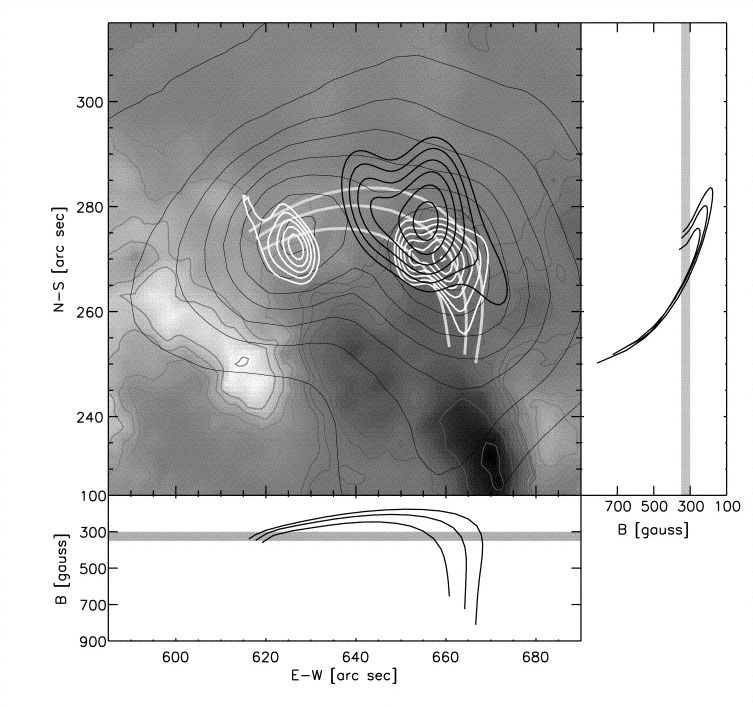
The figure below gives a
good opportunity to see how trapping may be reflected in spatial observations.
From Lee, Gary & Shibasaki (2000)
Here we see three different
frequencies, 17 GHz (thin contours, from Nobeyama), 10.6 GHz (white contours,
from OVSA), and 5 GHz (thick black contours, from OVSA), along with expected
field line locations from a photospheric field extrapolation. This
is an asymmetric loop (the right side has much higher field strength than
the left side), and we see that the electrons apparently mirror at some
height above the footpoints on that side.
Some presentations from the
FASR workshop, at http://www.ovsa.njit.edu/legacy/fasr/May_program.html
:
Nobeyama (Shibasaki)
OVSA (Lee)
Time Scales (Aschwanden)


