Go to ECE 291 Experiment  1   |   2    |  3   |   4   |  5   |  7   |  8   |  9   |   10   |   11   |    ECE Lab home

ECE 291 - LABORATORY VI

RC CIRCUITS; PASSIVE FILTERS


OBJECTIVES

To measure and analyze the time response of an RC circuit to a step voltage. To measure frequency responses of low-pass and high-pass RC circuits and plot frequency response graphs (Bode plots) of the amplitude and the phase.

INTRODUCTION

In this set of experiments we will explore perhaps the most important electrical circuits. Although they contain only two elements, a resistor and a capacitor, they model the behavior of much more complex circuits and devices. Capacitance and resistances are present in every electrical circuit, whether they are placed there on purpose or are the unavoidable consequence of the fact that every component or connection has some resistance as well as capacitance. These characteristics will ultimately define the device performance. For example the building block of digital circuits, the MOS transistor, has both resistance and capacitance which limit the speed of this device. Coupling capacitors are used between circuits which have their own internal impedance and thus form filters which may limit the frequency response of the whole system. In short: good knowledge of RC circuits is essential for anyone who wants to understand analog or digital electronics.

The experiments will demonstrate the effects of filters on sinusoidal signals, the dependence of the output voltage on frequency. Because any other waveform (such as a square wave) can be represented as a superposition of sinusoidal signals, this frequency dependence results in distortion of the shape of those signals.


PRELAB

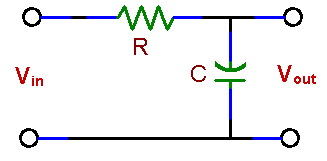
1.    What is the response of a simple low-pass RC filter (fig. 8 a) to a square-wave input? How will you measure the time constant (t = RC) of this circuit using an oscilloscope?

Hint: Vout is a voltage across a capacitor C which is charged and discharged from a source Vin through a resistor R. The scope gives you this voltage as a function of time.

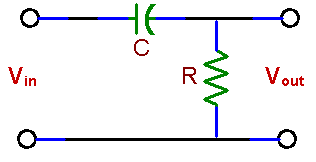
2.    Draw approximate frequency responses for circuits (a) and (b). Indicate the filters characteristic frequency, called also the break frequency or the corner frequency. At that frequency the power drops to ˝ of the power in the filter pass-band. Since the output voltage drops then by 3 dB, the frequency is also designated as f -3db. How does this frequency depend on R and C?

Note: number of db = 10 x log (P2 / P1) where P1 and P2 are powers which are being compared. Since power depends on a square of voltage or current, the dB expressions are  20 x log (V2 / V1)  for comparing voltages and 20 x log (I2 / I1) for comparing currents.


Fig. 8 Passive filters:    (a) low pass     and     (b)   high pass


LABORATORY

Equipment from stock room: Parts kit, protoboard, cables, scope probe.

1.    LOW PASS FILTER (INTEGRATOR)

Using one capacitor and one resistor from your parts kit design a low pass filter with its pass frequency (f-3db) of a few kHz. Measure the values of the selected components.

Do you need the scope probe for measurements on this circuit?

a.    Response to a step voltage

Assemble the filter with the selected R and C. With a square wave at the filter input observe the output wave form. Using an oscilloscope determine the time constant and compare it with the value t = RC calculated from the measured resistance and capacitance used in the circuit. Check if the time constants on the rising and the falling parts of the waveform are the same. Make sure that you apply a square wave of low enough frequency so that the output waveform becomes flat before the input waveform changes polarity.

Sketch or print the square wave output with a period of approximately: 

 a) 6t, b) 2t, and c) t/3

Hint: To measure the time constant t, use the cursors on the digital scope screen. In one of the menus you can read the voltage at the point where a waveform crosses a vertical cursor. This gives you information on the voltage and time, together. The scope may also show the signal "rise time" tr i.e. the time it takes for a signal to increase from 10% to 90% of its maximum value. ( tr @ t × ln9).

Demonstrate that for a certain frequency range the circuit behaves as an integrator i.e. the output is proportional to the integral of the input signal. You may have to increase frequency to see this effect. Print the scope image. In what frequency range the circuit performs as an integrator?

b.   Response to a sinusoidal signal (frequency domain analysis)

Drive the circuit with a sine wave and measure its frequency response by recording the input and output voltages for different frequencies. Keep the generator voltage constant. Find the frequency f-3db at the -3 dB gain. Your data should include several points above f-3db, if possible within two decades above that frequency. Make preliminary graphs of the amplitude as a function of frequency in the laboratory; you will have a chance to repeat measurements that do not fit the expected distributions.

Measure phase shifts between input and output signals at 0.1 f--3db, f--3db, and f = 10 f--3db. Measurement of the phase shift is an accurate method of determining the filter characteristic frequency (f--3db). Try.

2.    HIGH PASS FILTER (DIFFERENTIATOR)

Exchange positions of the capacitor and the resistor in your circuit. Show that the circuit acts as a high-pass filter. You do not need to make as many measurements as in the case low pass filter. Now that you know what to look for, obtain data at a few selected frequencies. Find the frequency f-3db.

Apply a square wave input to the circuit with frequencies approximately f-3db /5 and 5 f-3db. Sketch or print the output waveform.

Next, apply a triangular wave to the input. Observe the output while varying the generator frequency. Does the filter behave as a differentiator? If so, in what frequency range? Print the scope image. You may have to decrease frequency to see this effect.

3.    CIRCUIT SIMULATION (at home).

Simulate measurements 1 a), 1 b), and 2: frequency responses of amplitude and phase, and the time dependence of current with a square wave input for low pass and high pass filters. Use the same values of R and C in simulations as in the laboratory. Compare results of simulations with measurements.


REPORT

  • Compare the measured and calculated time constants of the circuit in 1. Comment on their agreement. Include sketches or printouts of output waveforms.


  • Plot amplitude and the phase shift data for circuits in 1 and 2. Use log scale for frequency and log or dB scale for amplitude. Does the filter attenuate the signal 6 dB/octave (or 20 dB/decade) ?


  • On the same graphs plot theoretical curves representing the frequency responses of the amplitude and the phase calculated from the known formulas with the values of R and C used in your circuit. Comment on possible reasons for differences between the theoretical and the measured curves, if there are any.

PSPICE simulation results may be used for comparison with experimental  .

  Go to ECE 291 Experiment  1   |   2    |  3   |   4   |  5   |  7   |  8   |  9   |   10   |   11   |    ECE Lab home