Go to ECE392 Experiment | 1 | 2 | 3 | 4 | 6 | 7 | 8 | Lab manuals | ECE Lab home
![]()
|
|
Go to ECE392 Experiment | 1 | 2 | 3 | 4 | 6 | 7 | 8 | Lab manuals | ECE Lab home |
|
ECE 392 - Electrical Engineering Laboratory II
EXPERIMENT V
OPERATIONAL AMPLIFIERS; ACTIVE FILTERS
OBJECTIVES
Frequency response of operational amplifiers. Relation between bandwidth and gain. Slew rate. Design of first order active filters with operational amplifiers.
INTRODUCTION
Before building filters with operational amplifiers (so called active filters) we have to investigate the frequency response of a simple op-amp circuit. The circuit behaves, in fact, like a low pass filter and thus can be used as an amplifier only in a limited frequency range. There is a rule that applies to these circuits which says that the gain bandwidth product (GBP) is a constant. It means that one can trade gain for a wider frequency response. The specifications of a popular 741 op-amp give the open loop gain (no feedback) as 200,000 and the bandwidth limiting frequency of only 5 Hz (GPB = 1 MHz). From the GBP rule one may expect, for example, the bandwidth of 100 kHz with gain of 10. There are many other op-amp on the market today with larger GBP.
Frequency response is not the only
characteristic that limits the speed of an amplifier. Slew rate
or the maximum rate of output voltage increase is often more important in many
applications which call for large signal amplitude. To
understand the difference between the two consider the
fact that frequency response is defined independently of the signal amplitude.
If, however, the output amplitude is increased (say, by increasing the input
voltage, not necessarily the gain), then the voltage has to
increase faster (in V/ms) as the slope of the sinewave
increases, even as its frequency does not change. Internal structure of
an op-amp circuit limits this maximum slope which makes steep parts of a sine
wave look like a ramp, distorting the signal.
Decreasing the signal amplitude, without lowering the
frequency, restores the proper waveform shape.
PRELAB
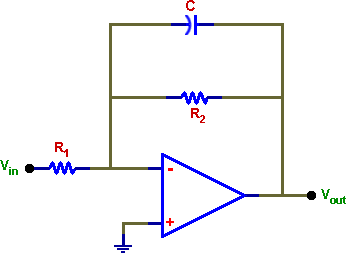
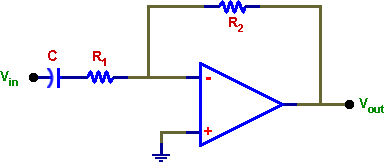
Design a first order low pass and a high pass filters using an op-amp and components available in your kit. Choose reasonable f-3dB frequencies, from tens of Hz to tens of kHz, so that you can test these circuits with the equipment at your bench. The high pass filter should have much lower f-3dB than the low pass filter. Simulate performance of the circuits (frequency response) with PSPICE.
References:
P. Horowitz and W. Hill The Art of Electronics, second edition, Cambridge University Press 1989, 2nd edition, pp. 187-224
T. C. Hayes and P. Horowitz "Student Manual for The Art of Electronics", pp.184-203.
S. Franco "Design with Operational Amplifiers and Analog Integrated Circuits", McGraw-Hill 1988. Chapter 3, especially section 3.3.


Low-pass and High-pass single stage active filters
LABORATORY
Equipment needed from the stockroom: scope probe, resistance substitution box, leads.
1.
FREQUENCY RESPONSE OF A NONINVERTING
AMPLIFIER AND THE GAIN
BANDWIDTH PRODUCT (GBP)
Assemble a non-inverting amplifier with a low gain, up to 10. Check its frequency response. Op-amp performance is limited at high frequency; it behaves as a low-pass filter. Measure its bandwidth, which is defined by f-3dB frequency.
Repeat the bandwidth measurements for two more resistor sets, with the amplifier gain in tens and hundreds range. Measure the gain and the bandwidth in each case.
Note: It is not necessary to measure a whole frequency distribution for the three cases. Measure it for the first case and then find quickly f-3dB for the other two. A good way is to look at the phase shift between input and output signals.
2. SLEW RATE
Measure the slew rate of the non-inverting amplifier by feeding a square wave at the input. You will get this parameter from the slope of the output waveform which will not change with increasing signal amplitude.
3. LOW-PASS FILTER
Build the low-pass filter of your design and check its frequency response. Drive the circuit with a sine wave and record input (constant) and output voltage for different frequencies. Be sure to obtain more points at the "interesting" part of the curve, near and well above f-3dB. Make preliminary graphs of the amplitude as a function of frequency in the laboratory; you will have a chance to discover early if something is wrong.
Measure also the phase shift between input and output signals. The goal is to see the phase shift as the frequency increases, passing through f-3dB. Make the measurements also at much lower and much higher frequencies than f- 3dB. Measurement of phase shift is an accurate method of determining the filter characteristic frequency (f- 3dB).
4. HIGH-PASS FILTER
Build the high-pass filter of your design and test it like the low pass filter, above. Build the circuit on the same board but using different components. If you have more than one op-amp in the same package common power supply wiring will serve both circuits.
5. BAND-PASS FILTER
Connect the two circuits (high-pass and low-pass filters) in series to obtain a band pass filter. (Does it matter which is first?) Verify that it performs as a band-pass filter. Alternatively, you may build a wide-band filter with a single op-amp, as shown in the figure below. For this filter to work well, the low-pass frequency (low f-3dB) should be much lower than the high-pass (high f-3dB) frequency.
REPORT
Besides the usual circuit information, schematics, etc. attach tables with the data on frequency response measurements (amplitude and phase). Make graphs of the measured frequency distributions and attach graphs from the PSPICE simulations, also for the bandpass filter. Discuss the agreement (or lack of it) between the measured and predicted functions.
|
|
Go to ECE392 Experiment | 1 | 2 | 3 | 4 | 6 | 7 | 8 | Lab manuals | ECE Lab home |
|