|
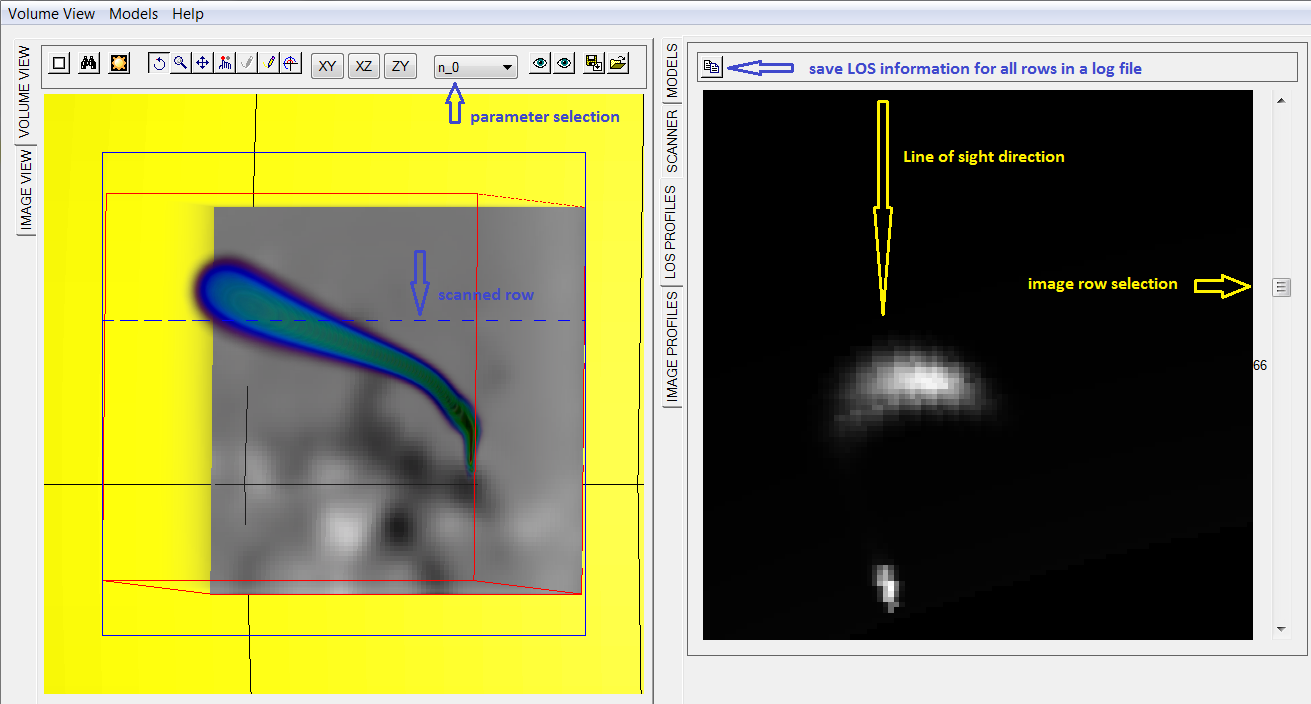
GX_Simulator scans the properties of the model along the line of sight (LOS) one image row at the time and displays it in the LOS PROFILES plot. The index of the image row to be scanned is set by the right hand side vertical slider, while the parameter displayed is determined by the selection made using the pull-down menu located on the Volume View toolbar.
For debug purposes, the LOS information for all rows of the FOV may be saved to a file in a self describing format using the SSW routine MULTI_SAVE, which may be restored using the MULTI_RESTORE routine.