Green Chemistry in Teaching Laboratory
Microwave Induced Reactions
|
Comparison of Heating Efficiency by Microwave and Electrical Hotplate Introduction The typical methods of heating in chemistry laboratories involve the use of electric hot plates, Bunsen burners and heating ovens. Depending upon the application, microwave heating can be used to replace these conventional methods. Microwaves works by directly coupling with the polar molecules in a substance. This causes the particles to move and rotate which in turn generates heat. Microwave ovens operate with electromagnetic non ionizing radiation with frequencies between 300 GHz and 300 MHz. The corresponding wavelengths span a range from 1 mm to 1 m, which places microwaves in-between that of infrared radiation and radio waves. Most commercial microwave systems however utilize irradiation with a frequency of 2450 MHz (wavelength λ = 0.122 m) in order to avoid interferences with telecommunication devices. The corresponding electric fields oscillate 4.9 X 10⁹ times per second and consequently subject dipolar species and ionic particles (as well as holes and electrons in semiconductors or metals) to perpetual reorientation cycles. This strong agitation leads to a fast non-contact heating that is (approximately) more or less uniform throughout the radiation chamber. Consequently, faster heating rates are expected in microwaves. In order to give more emphasis on the energy aspect of these experiments, it is important to compute the actual power consumption in both conventional and microwave heating methods. Every heating system has in-built temperature sensors that turn on/off according to the temperature control set in it. Therefore, the heating device consumes energy only when the power is on. A simple calculation that uses the product of power rating and time led to erroneous results. An inexpensive solution that could be employed is a commercial power meters that can be connected online to the heating device or the microwave. The one selected for this project is called P3 Kill-A-Watt (P3 International Corporation, NY, USA) power meter, which is described below. P3 Kill-A-Watt meter is shown in Figure 1. It is a meter that is used for measuring the power consumption of house hold appliances. This device records six parameters which including voltage, current, wattage, frequency and energy consumption. The measurements are displayed on an LCD screen. The power meter is connected to the main power supply unit while the outlet of the appliance is connected to the power meter. The total power consumed over a period of time is measured in units of Kilo Watt hour (KWH). Both volts and amperes are measured using true RMS method.
Figure 1. Schematic diagram (left) and photograph (right) of a Kill-A-Watt power meter. Materials Required
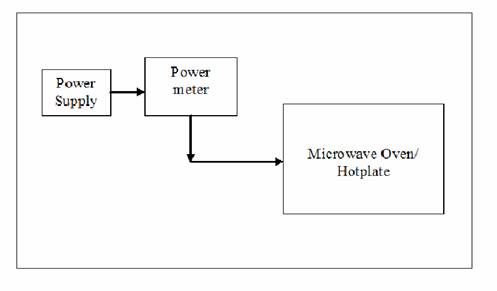
Experimental Procedure The efficiency of the two methods was compared by using 1000 ml of water in two separate 1000 ml glass beakers and heated by microwave and electric hotplate for different periods of time. The power rating on the hot plate was 865 Watts (51.9 KJ/min) and that of microwave oven was 850 Watts (51 KJ/min). The rise in temperature as a function of time was recorded in each case. The experimental setup is shown in Figure 2. In another set of experiments the effect of volume was computed as follows. Hundred ml volume of water was initially heated for a period of 3 minutes using hot plate. Different volumes in the increments of 100ml were heated for 3mins and the final temperature in each case was recorded. The experiment was repeated with microwave heating, and the corresponding temperatures were recorded.
Figure 2. Experimental setup using the power meter. Results and Discussion In the first set of experiments, the variation in temperature as a function of volume of water is presented in Figure 3 (a). The temperature decreased significantly as the volume of water increased in both convective and microwave heating. As the volume of water increased, it consumed more energy to raise the temperature. We observed significant decrease in temperature with convective heating, as heat transfer limitations are more prominent with convective heating. For the same volume of water heated for same duration of time, we could see a temperature difference between 20 - 40˚C, with microwave heating being significantly more efficient. The energies consumed by the two heating devices for heating same volume of water for the similar duration of time are shown in Figure 3(b). The trends were similar, but the absolute numbers were different for the two devices although their power ratings were very close. The microwave consumed less energy but reached higher temperature, which clearly demonstrated the higher efficiency of this approach.
(a) (b) Figure 3. (a) Plot of temperature as a funtion of volume at aconstant time duration of 3 mins. (b) Plot of energy consumed as a function of volume for a heating time of 3mins. Figure 4(a) shows the temperature of water as a function of time at a constant volume of 1000 ml. During microwave heating, the water temperature increased steadily and leveled off near the boiling point. The rise in temperature was much more gradual with the hotplate. At high temperatures, the vapor pressure of water was quite high, and some water was lost via evaporation. The rate of increase in temperature with increasing time was clearly higher for the microwave than for heating on the hotplate. Figure 4(b) shows temperature reached as a function of energy consumed by each device. It is quite evident that for the same energy consumption, the microwave is a significantly more energy efficient device.
(a) (b) Figure 4. (a) Plot of temperature as a function of time for heating 1000ml of water. (b) Plot of temperature as a function of energy corresponding to Figure 4 (a). Energy Calculations Table 1: Energy consumed by both heating devices as recorded by power meter:
Difference in Calculated and Recorded Values: Energy = Power x Time Microwave Oven: Energy Consumed = 51.0 KJ/min x 3min = 155.7 KJ Hot Plate: Energy Consumed= 51.9 KJ/min x 3 min = 153.0 KJ Therefore, the percentage of error for microwave oven is,
and the percentage of error for hot plate is,
Summary
|