Green Chemistry in Teaching Laboratory
Microwave Induced Reactions
|
Extraction of Iron from Oat Meal
Iron is an important nutrient for plants and animals. Iron is a major component of the pigment called “heme” which acts as oxygen carriers in the human body. Deficiency in iron leads to anemia. The greatest need for iron is during growth or periods of blood loss. Young children, adolescents and pregnant women have increased needs for iron because of the growth processes during these periods. In order to make up for the regular iron loss, iron has to be supplemented in the regular diet through food. The measurement of iron in food stuff is for great importance. Since iron in most food products is at trace levels, its analysis is relatively complicated. Typically the metal is first extracted using a solvent (acid or chelating agent) and then analyzed. The objective of this experiment is to extract iron from food using conventional method such as hot plate and then compare it to microwave. The experiment involves acid extraction and the estimation of extraction efficiency. Materials Required
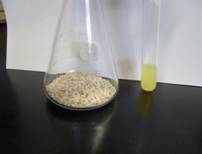
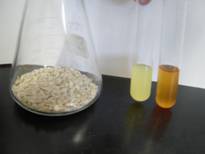
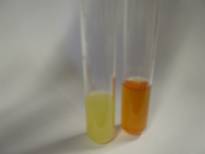
Experimental Procedure 1% Potassium Thiocyanate (KSCN) was prepared by dissolving 1.0 g of potassium thiocyanate in 100 ml of 10% nitric acid solution. 10mg/ml Iron (III) Chloride stock solution was prepared by dissolving10g of Iron (III) Chloride Hexahydrate in 1litre of 10% nitric acid solution. Five dilute standards of 0.2, 0.4, 0.6, 0.8, and 1.0 mg/mL were then prepared from the stock solution. Sample Preparation A measured volume 50mlof 10% nitric acid solution was added to 10g of oatmeal (from Grocery store) and heated on a hot plate until the oatmeal dissolved. The time taken for the extraction reaction to go to completion was recorded. The solution was then filtered and 0.1ml of 1% KSCN was added to the filtrate forming a blood red colored complex represented by equation 5. The absorbance of the colored complex was measured at 450 nm on a UV spectrometer. The process was repeated in a microwave oven to compare the extraction efficiency. The change in color is show in the figure 11.
Scheme 4. Formation of ferric thiocyanate complex. A calibration curves was generated by successive dilution of standard 10% nitric acid, and 0.1 mL of 1% KSCN solution was added to the dilute standards and their absorbance measured at 450nm on a UV-spectrometer using 10% nitric acid solution as a blank. Absorbance was plotted against the concentration of standards and is presented in figure 12.
Figure 11. (a) Represents the iron extracted from oats before the formation of the color complex. (b) Along with the formation of color complex. (c) Represents the extracted iron with and without color complex. Results and Discussion The iron is extracted from oat meal by acid extraction method, which dissolves the oat meal on heating. The filtrate separated from the extract forms color complexes with potassium thiocyanate solution, which is analyzed using a UV- Spectrometer. Figure 12 represents the calibration curve obtained by plotting the absorbance of known concentrations. The concentration of iron extracted from oat meal is interpreted from the standard graph. The efficiency of extraction through microwave oven and conventional method of heating was compared by the amount of iron extracted and the time taken for the extraction process.
Figure 12. Calibration curve for iron content determination. Table 6. The energy consumed and the concentration of iron extracted by different heating methods.
Difference in Calculated and Recorded Values: Energy = Power x Time Microwave Oven: Energy Consumed = 51.0 KJ/min x 3 min = 108 KJ Hot Plate: Energy Consumed= 51.9 KJ/min x 15 min = 468 KJ The percentage of error for microwave oven is,
and the percentage of error for hot plate is,
Therefore, the percentage of energy saved by the microwave oven over the conventional oven as recorded by the power meter is,
From the results it is evident that though the hotplate took five times as much time to complete extraction, a slightly higher concentration of iron was extracted in the microwave process translating to about 77% energy saving. The direct heating capability of microwaves can be credited with the superior heating and extraction efficiency.
|